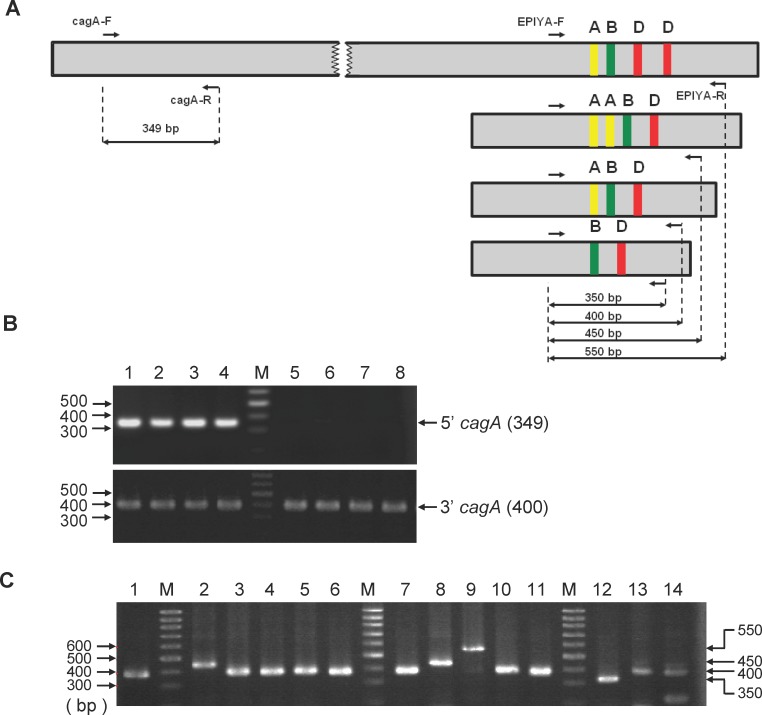
Fig 2. PCR amplification of the cagA 5’ constant region and the 3’ variable region.
(A) Schematic representation of the relative primer site of the cagA gene (small arrows) used in this study, and the expected sizes (long arrows) of the amplified specific EPIYA motif products. (B) Genomic DNA from H. pylori colonies was used as templates to amplify the 5’ (above) and 3’ (below) ends of the cagA gene by PCR using the gene specific primers as described in the Materials and Methods. PCR products were separated by electrophoresis using 2% agarose gels that were stained with ethidium bromide. Lanes are: M, 100-bp DNA markers. 1, GC 25–1; 2, GC 68–1; 3, GU 71–1; 4, GU 94–1; 5, GC 25–5; 6, GC 68–6; 7, GU 71–2; and 8, GU 94–3. Shown on the right are the sizes of the PCR products in base pairs. (C) PCR analysis of the cagA 3’ region expressing variable number of EPIYA motifs. Lanes are: M: 100-bp DNA markers. 1, H. pylori 26695; 2, GC 6–1; 3, GC 6–2; 4, GC 7–1; 5, GC 7–2; 6, GC 7–3, 7, GC 11–1; 8, GU 12–1; 9: GU 13–1; 10, GU 13–2; 11, CG 14–1; 12, GC 21–3; 13: DU 47–3; and 14, DU 64–3. Shown on the right are the sizes in base pairs.

