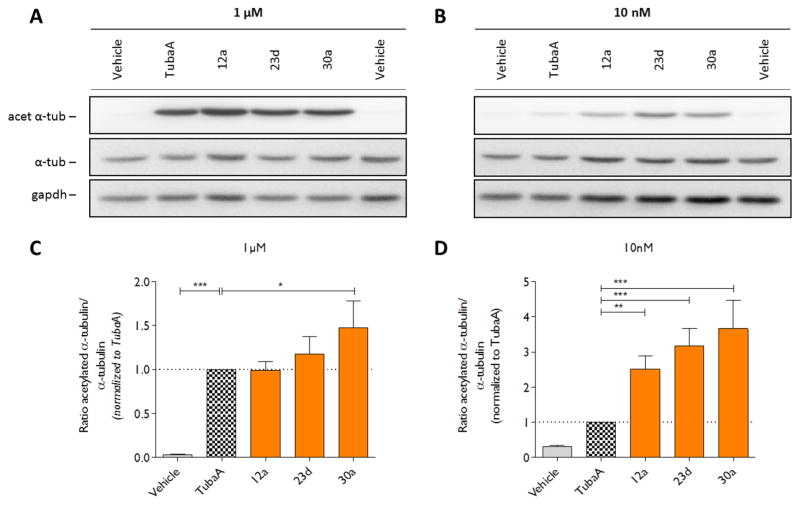
Figure 3.
Compounds 12a, 23d, and 30a selectively inhibit HDAC6 in N2a cells. (A and B) Incubation of N2a cells with 1 μM or 10 nM of the HDAC6 inhibitors results in an increased acetylation of α-tubulin. (C and D) WBs were quantified by measuring the ratio of acetylated α-tubulin to the total amount of α-tubulin. The values were normalized to tubastatin A (TubaA) within each experiment. Graphs represent means with SEM. Dunnett’s multiple comparison test. *p < 0.05, **p < 0.001, ***p < 0.0001. N = 4.

