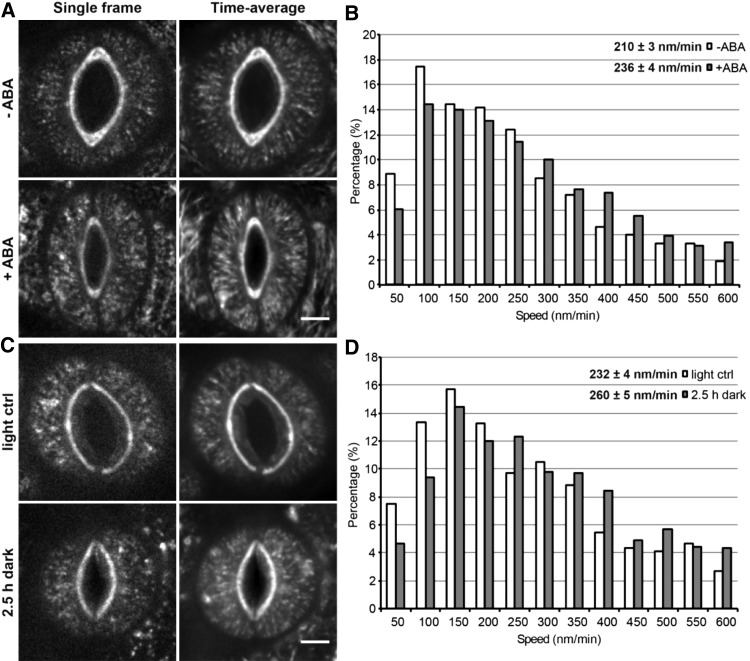
Figure 1.
GFP-CESA3 particle motility increases in stomatal guard cells induced to close by ABA or dark treatment. A, Distribution of GFP-CESA3 particles and tracks in open or closed stomatal guard cells of 6-d-old seedlings in the absence or presence of 50 µm ABA, respectively. Single-frame images are on the left, and time average projections of 31 frames (10-s interval, 5-min total duration) are on the right. Bar = 5 µm. B, Histogram of GFP-CESA3 particle speed distributions (n > 1,250 particles in more than 26 guard cell pairs from at least nine seedlings per treatment, three independent experiments; P < 0.01, Student’s t test). C, Distribution of GFP-CESA3 particles and tracks in open or closed stomatal guard cells of 6-d-old seedlings grown on one-half-strength Murashige and Skoog (MS) + 1% Suc plates under light control or 2.5-h dark conditions, respectively. Single-frame images are on the left, and time average projections of 31 frames (10-s interval, 5-min total duration) are on the right. Bar = 5 µm. D, Histogram of GFP-CESA3 particle speed distributions (n > 1,000 particles in more than 20 guard cell pairs from at least nine seedlings per treatment, three independent experiments; P < 0.01, Student’s t test).

