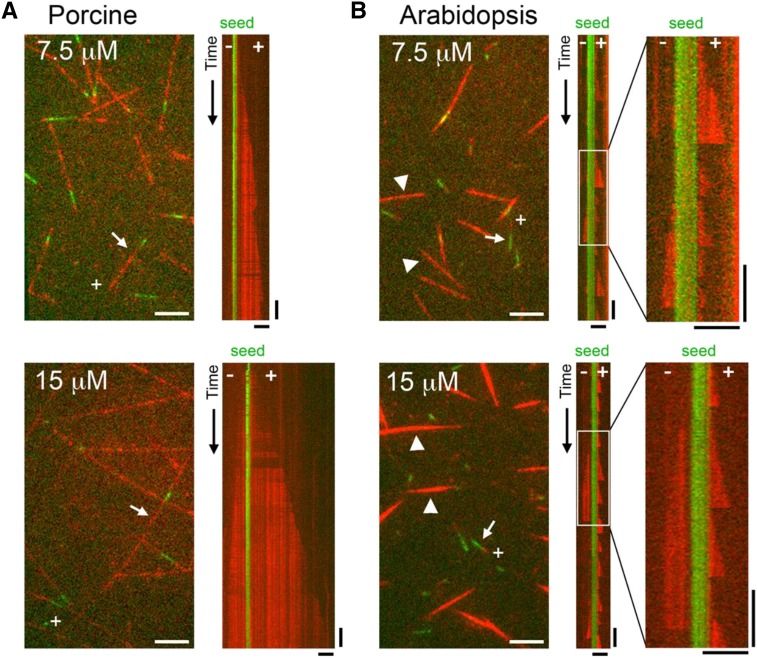
Figure 2.
In vitro MT dynamics assay. MTs polymerized from various concentrations of porcine brain tubulin (A) or Arabidopsis cell culture tubulin (B) were observed using TIRF microscopy. Top images, 7.5 μm tubulin; bottom images, 15 μm tubulin; red, rhodamine-labeled MTs; green, immobilized MT seeds. Kymographs were drawn for the MTs indicated by arrows. MT polarities are shown in the images and kymographs, with + and − indicating the plus and minus ends, respectively. Enlarged kymographs correspond to the boxed areas in the original kymographs in B. Representative MTs nucleated independently of the MT seeds are indicated by arrowheads in B. Horizontal bars = 5 μm and vertical bars = 2 min.

