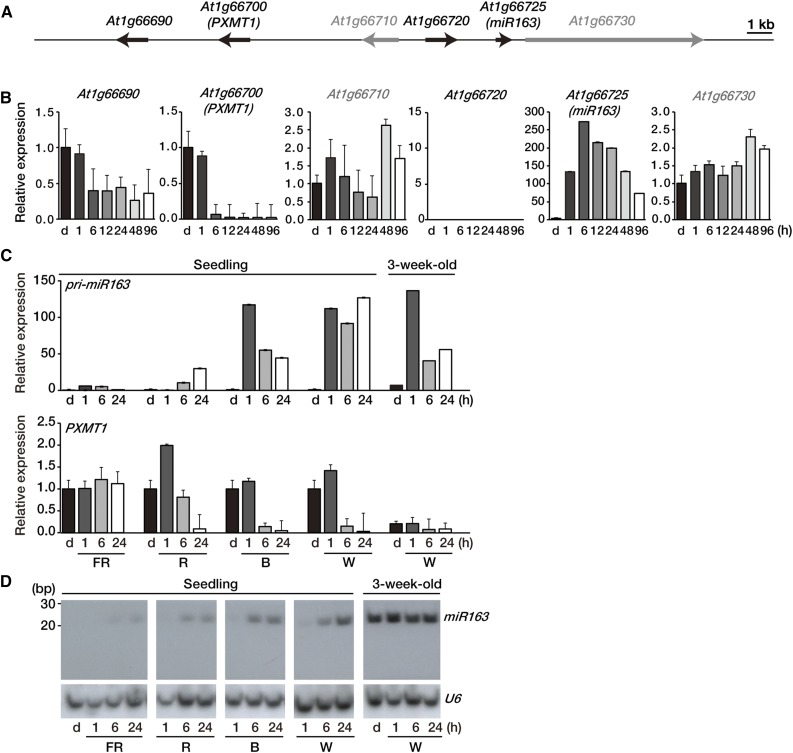
Figure 1.
Expression levels of miR163 and PXMT1 during seedling de-etiolation. A, Schematic diagram showing the location of miR163 (At1g66725) and its putative targets on chromosome 1. Putative targets (At1g66690, At1g66700, and At1g66720) of miR163 and neighboring (At1g66710 and At1g66730) genes are shown as black and gray arrows, respectively. The arrows in the diagram indicate transcriptional directions. Bar = 1 kb. B, Expression of pri-miR163, its putative targets, and neighboring genes during seedling de-etiolation. Four-day-old etiolated Arabidopsis seedlings (d) were treated with W light as indicated (1, 6, 12, 24, 48, and 96 h). Expression levels were determined by qRT-PCR with specific gene primer sets and normalized with Actin2 expression level. Values were normalized to that of the etiolated sample (d) of each graph. Error bars indicate sd (n = 3). C, Expression levels of pri-miR163 and PXMT1 during seedling de-etiolation under different light qualities. Four-day-old etiolated Arabidopsis seedlings (d) were treated with FR (5 µmol m−2 s−1), R (20 µmol m−2 s−1), B (10 µmol m−2 s−1), and W (100 µmol m−2 s−1) light as indicated (1, 6, and 24 h). Expression levels were determined by qRT-PCR as described in B. Values were normalized to that of the d sample of each panel. Error bars indicate sd (n = 3). D, Small RNA gel-blot analysis showing miR163 expression during seedling de-etiolation. Total RNA was extracted from the samples described in C. U6 snRNA levels were used as a loading control.

