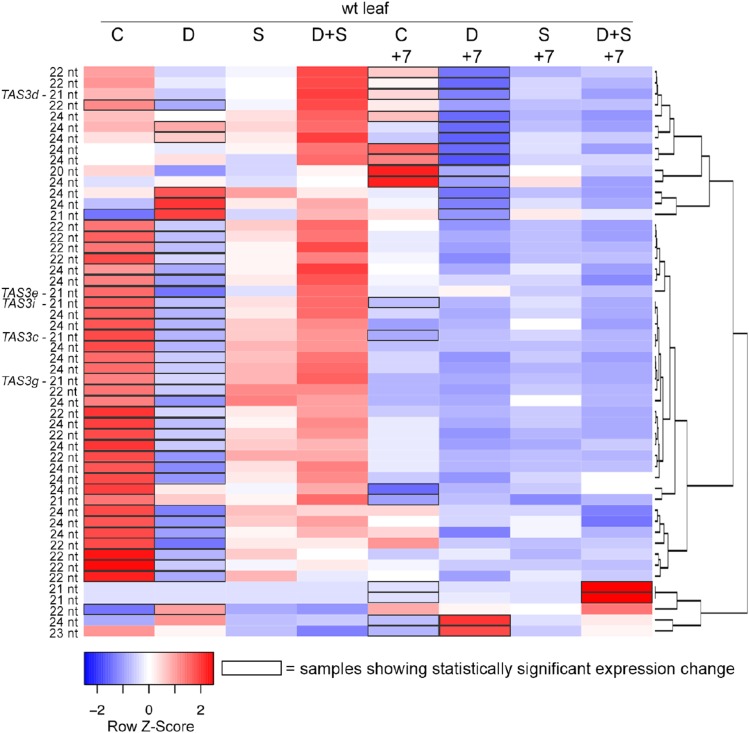
Figure 10.
Stress-induced changes in sRNA accumulation. Heat map showing expression levels of sRNA loci that are differentially expressed in at least one pairwise comparison between control and a stress-treated wild-type leaf sample. C, control; D, drought; S, salinity; D+S, drought and salinity stress, after 10 d of treatment and after 7 d of recovery (+7). The mean reads per million mapped values from the three biological replicates were calculated, after which each row was scaled to have a mean of zero and a sd of 1. Black boxes indicate samples with statistically significant expression changes at a false discovery rate of 0.01. Dendrogram shows hierarchical clustering of rows based on Pearson distance. The predominant RNA size of each sRNA locus is indicated on the left.

