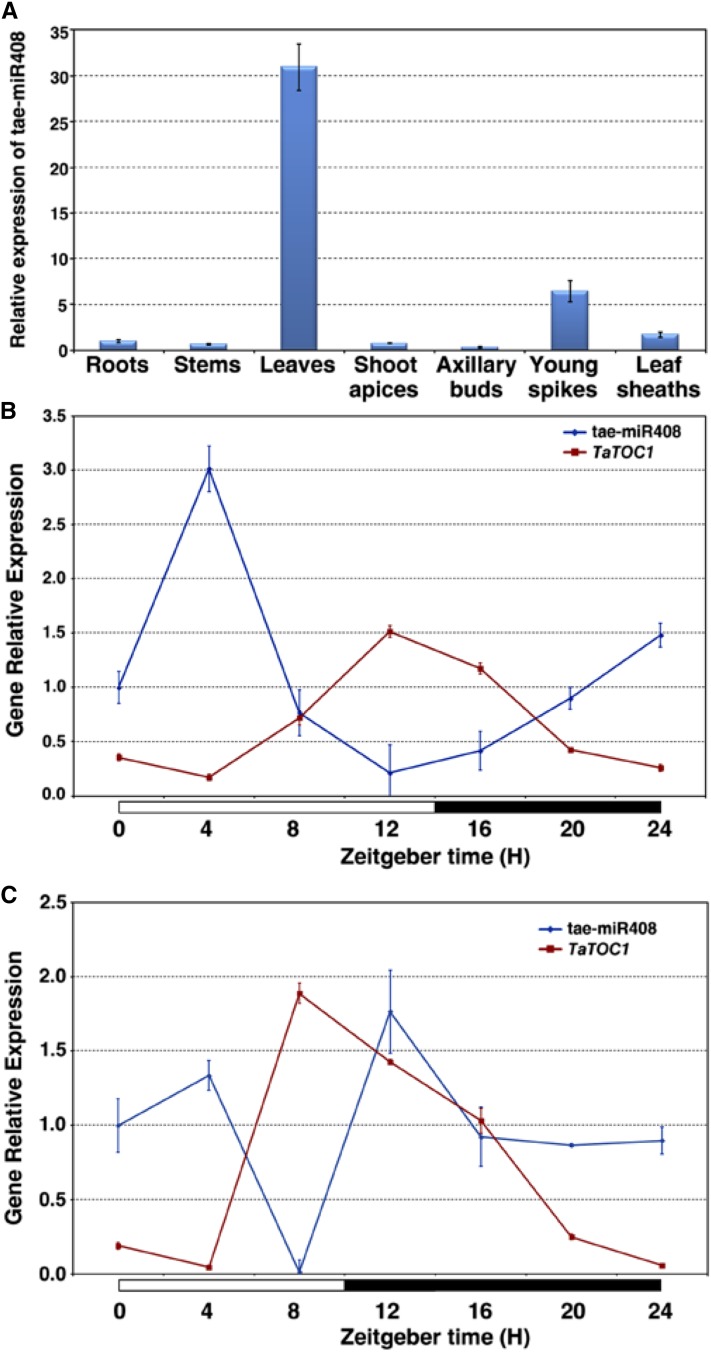
Figure 6.
Expression Pattern of tae-miR408. A, qRT-PCR analysis of tae-miR408 expression in various wheat organs, including the roots, stems, shoots apices, axillary buds, young spikes, and leaf sheaths. B and C, Diurnal expression patterns of tae-miR408 and TaTOC1s under LD (B) and SD (C) conditions. The white and black boxes at the bottom of each graph in B and C represent light and dark periods, respectively.

