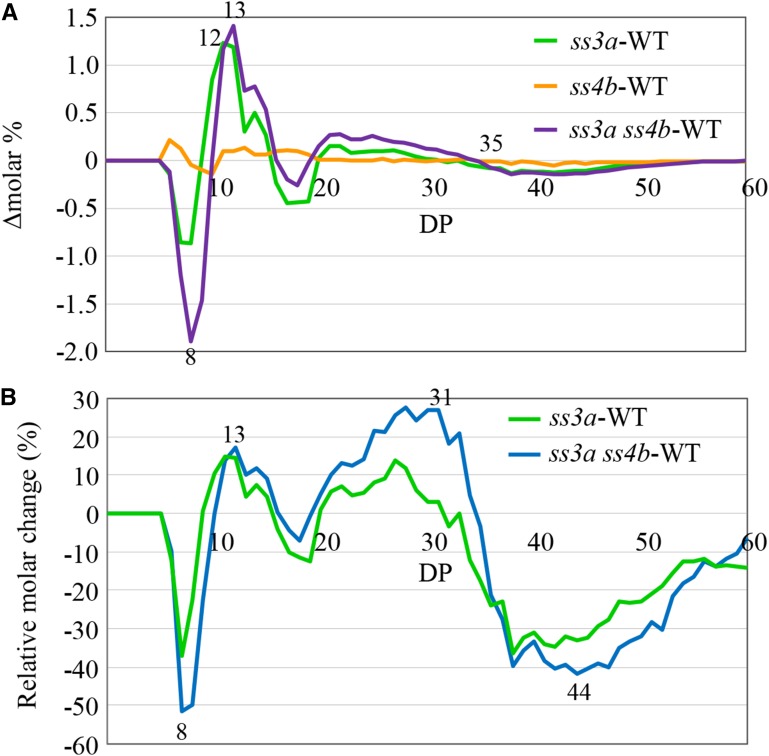
Figure 9.
Chain length distribution patterns of amylopectin in wild-type rice and mutant lines. A, Differences in the chain length distribution patterns (Δmolar%) between mutant lines and wild-type cv Nipponbare (WT). Values represent averages of three seeds arbitrarily chosen from a single homozygous plant. B, Relative molar changes of each amylopectin chain (Δmol %/mol % × 100) calculated from the data shown in A for DP 6 to 60 for the wild type, ss3a, and ss3a ss4b (#2012). The numbers on the plots are DP values.

