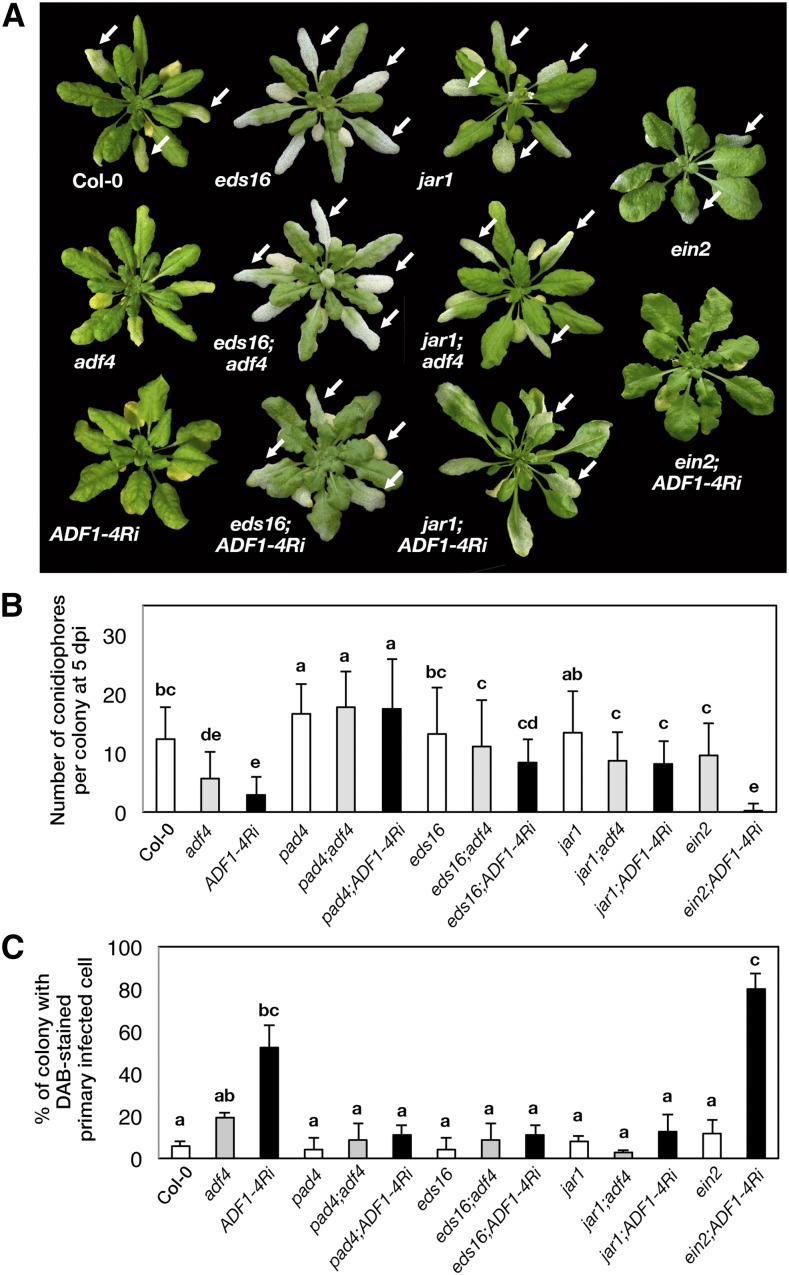
Figure 3.
Mutations with defects in SA and JA signaling suppressed the increased resistance to G. orontii in adf4 and ADF1-4Ri. A, Plants at 2 wpi with G. orontii. Leaves with powdery mildew mycelia are indicated by arrows. B, Number of conidiophores per colony counted at 5 dpi. The experiment was performed three times with similar results; results from one representative experiment are shown. Error bars indicate sd (n = 100). C, Percentage of the colony with DAB-stained primary infected cells at 5 dpi. Error bars indicate sd (n = 3 biological replicates). Comparisons between multiple groups were performed by ANOVA followed by the Tukey-Kramer test. The same letter indicates that there are no significant differences (P < 0.05).

