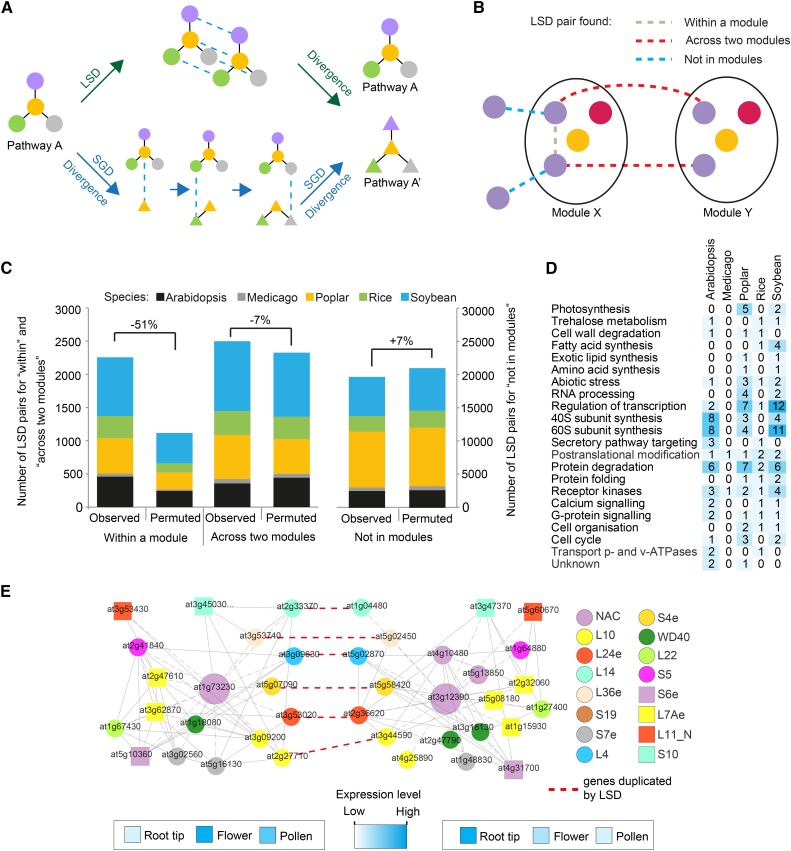
Figure 11.
Gene modules are not likely generated through large-scale gene duplication events. A, Two possible models for multiplying biological pathways. Colored shapes and edges represent genes and functional relationships between genes, respectively. Blue dashed edges depict recently duplicated genes. B, Three LSD types that can occur between two similar modules. Colored shapes represent gene families. Gray, red, and blue edges depict LSD-generated gene pairs that were retained within the same module, found across the modules, and not found within both modules, respectively. C, Colors and heights of the bars represent species and numbers of LSD-generated genes. Numbers denote percentage change between the observed and the average of permuted networks. D, Ontology analysis of modules enriched significantly for LSD gene pairs. E, LSD-enriched Arabidopsis modules involved in eukaryotic ribosome biosynthesis. Colored shapes represent label co-occurrences (key shown at right). Gray and red dashed edges represent coexpression relationships and LSD gene pairs, respectively. Heat maps represent expression levels of the module centers, genes At1g73230 and At3g12390.

