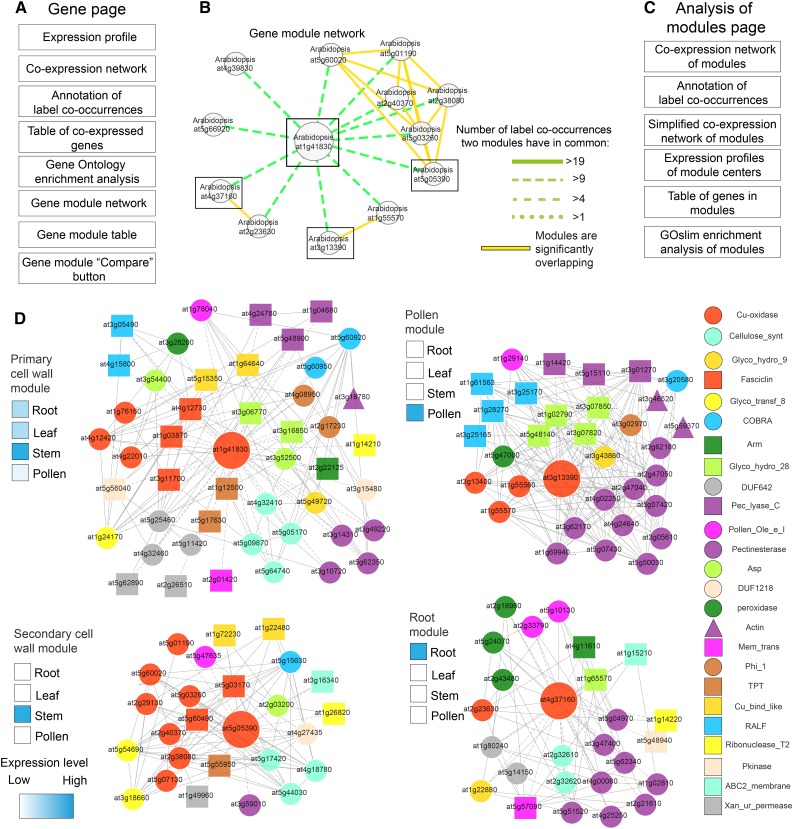
Figure 6.
Cell wall biosynthetic modules occur multiple times in plants. A, Contents of new gene pages in PlaNet. B, Arabidopsis gene modules similar to the primary cell wall module centered around At1g41830 (large node). Green edges indicate similarity strength between modules as the number of shared label co-occurrences. The figure was generated by right clicking on the network and selecting Toggle similarity within one species and setting the label co-occurrence cutoff to 10. Boxes indicate modules that are displayed in detail below. C, Contents of the analysis of modules page. D, Coexpression networks of selected cell wall-related modules. Nodes and edges represent genes and coexpression relationships between genes, respectively. Colored shapes of the nodes depict label co-occurrences found in the four networks, as seen in the legend at right. Large nodes represent genes serving as module centers. Expression profiles of module center genes were estimated from expression profiles generated by FamNet and are depicted by heat maps to the left of each module.

