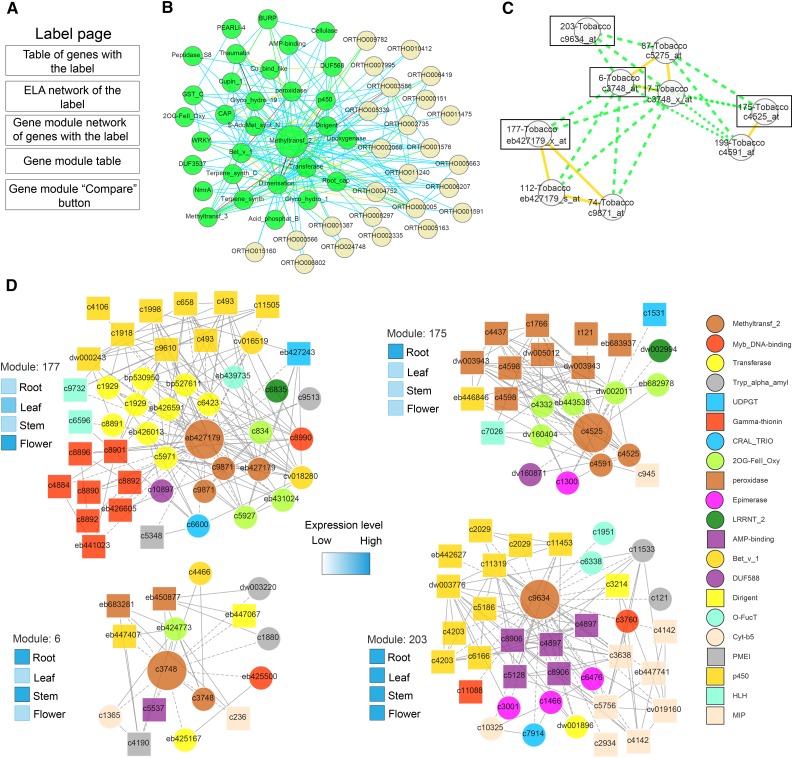
Figure 8.
Secondary metabolism-related modules in tobacco based on analysis of the methyltransferase_2 label. A, Contents of label pages. B, ELA network of methyltransferase_2. Nodes represent labels, and colored edges indicate in how many species an association was found (as in Fig. 1). C, Tobacco gene modules that contain the methyltransferase_2 label. Nodes and edges are described in Figure 6. Boxes indicate modules that are displayed in detail below. Tobacco modules were highlighted by clicking on Toggle internal similarities and toggling all other species off. D, Putative flavonol-related modules in tobacco. Nodes represent genes, and the colored shapes of the nodes indicate the label co-occurrence that the respective gene is associated with. Gray edges indicate coexpression relationships between the genes. Annotation of the label co-occurrences is at right. Expression profiles of module center genes are depicted by heat maps to the left of each module.

