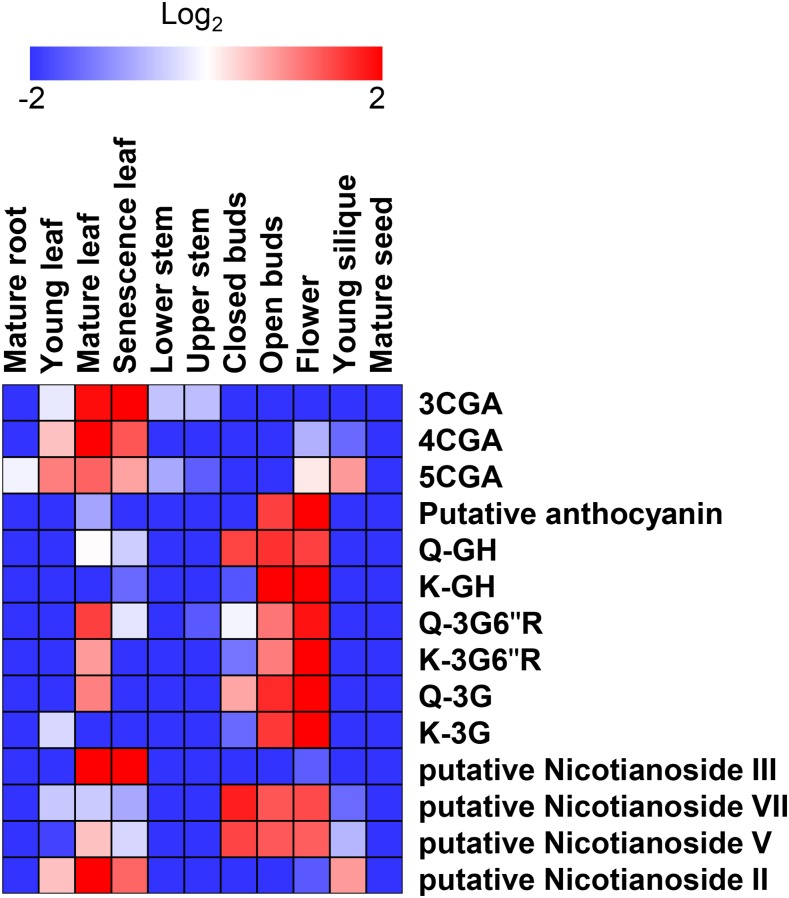
Figure 9.
Heat map visualization of secondary metabolite contents analyzed by LC-MS in tobacco tissues. The analysis was conducted with three independent biological replicates. Metabolite identification and annotation were performed using standard compounds from the literature and coelution profiles with tomato pericarp extracts. The relative peak area was normalized by an average value and shown with logarithmic scale. Fold change is visualized by color: red (high) and blue (low). 3CGA, 3-Caffeoylquinate; 4CGA, cryptochlorogenate; 5CGA, neochlorogenate; Q, quercetin; G, Glc; R, Rha; H, hexose.

