Figure 2.
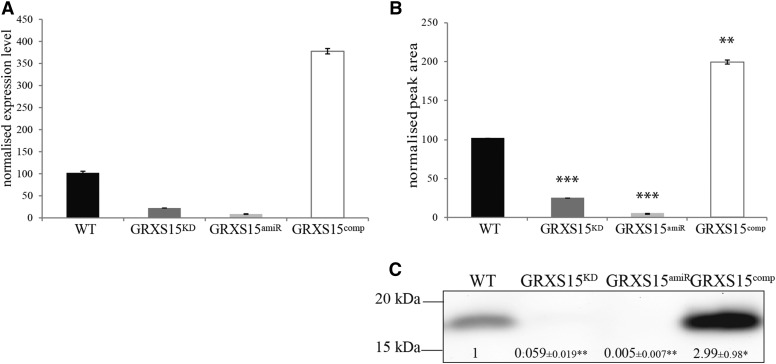
GRXS15KD T-DNA insertion knockdown and phenotype. A, Relative expression level determined by qPCR of GrxS15 transcript in wild type, GRXS15KD, GRXS15amiR, and GRXS15comp. Shown is average ± SD, n = 3. B, MRM analysis using two specific peptides for GrxS15 of whole tissue mitochondrial protein in wild type, GRXS15KD, GRXS15amiR, and GRXS15comp. Peak area was normalized to the total MS2scan and standardized to wild type. Shown is median ± sem, n = 3. Student’s t test has been performed, ** indicates P < 0.001, *** indicates P < 0.0001. C, Western blot analysis with primary antibody raised against GrxS15 using isolated mitochondria from whole tissue of wild type, GRXS15KD, GRXS15amiR, and GRXS15comp. Shown is an exemplary image with values obtained from densitometry analysis of all replicates. Median and SEM are displayed, n = 4. Student’s t test has been performed, * indicates P < 0.1, ** indicates P < 0.0001.

