Figure 4.
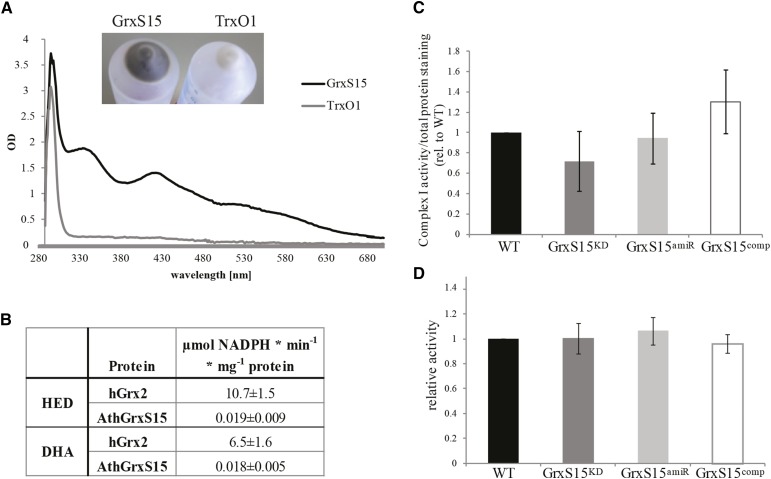
Fe-S cluster binding and activity of GrxS15. A, Spectrophotometric analysis of Fe-S cluster bound by purified heterologous expressed GrxS15 and another mitochondrial antioxidant protein thioredoxin O1 at 2.5 mg/mL. Insert shows the color of the E. coli pellet after heterologous expression of GrxS15 and TrxO1. n = 3, exemplary spectrum shown. B, Classical Grx activity assay was performed for GrxS15 and human Grx2 as comparison. HED and DHA assay were performed. n = 3; averages and sd were calculated. C, Densitometry quantification and statistical analysis of Complex I activity staining following separation of mitochondria isolated from whole tissue by Blue-Native PAGE, calculated as the ratio (complex I activity/total protein) relative to wild type. n = 5; shown is median and SEM, A student’s t test was performed, and no difference was detected. D, Aconitase activity assay using mitochondria isolated from whole tissue, calculated as the ratio of activity compared to wild type. n = 5, shown is median and SEM, A student’s t test was performed, and no difference was detected. The average wild-type aconitase activity was 94 nmol NADPH min−1 mg−1 mitochondrial protein.

