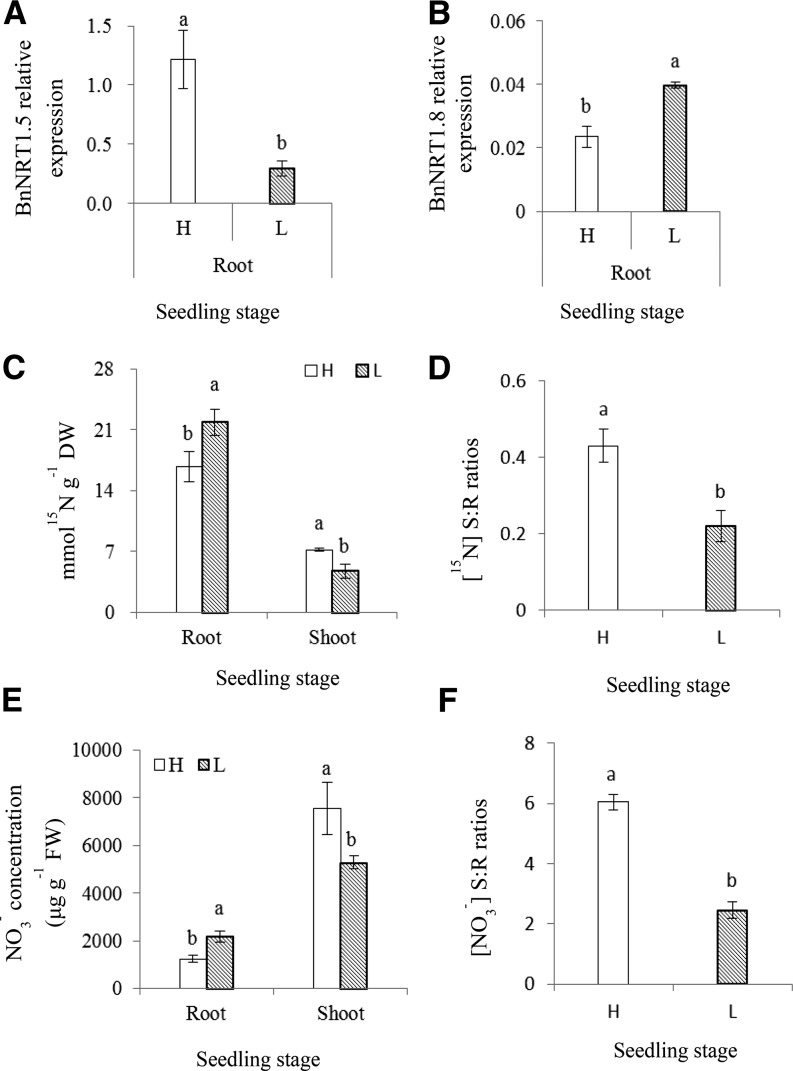
Figure 2.
B. napus with higher NUE showed enhanced long-distance transport of NO3− from roots to shoots at the seedling stage. H refers to the high-NUE genotype Xiangyou15 and L refers to the low-NUE genotype 814. Expression of the BnNRT1.5 (A) and BnNRT1.8 (B) genes relative to that of the actin gene in the root tissues of the two genotypes at seedling stage was assessed by quantitative RT-PCR as described in “Materials and Methods”; a value of 1.0 is equivalent to levels of expression of the Bnactin gene. Vertical bars on the figures indicate SD (n = 3); different letters at the top of the histogram bars denote significant differences at P < 0.05. Hydroponically grown B. napus plants were subjected to 15N-labeling treatment as described in “Materials and Methods.” The 15N concentration in the root and shoot tissues of the two genotypes is shown at the seedling stage (C). The [15N] S:R ratios in the root and shoot tissues of the two genotypes are shown at the seedling stage (D).Vertical bars on the figures indicate SD (n = 3), different letters at the top of the histogram bars denote significant differences at P < 0.05 level. The NO3− concentration (μg g−1 FW) in root and shoot tissues of the two genotypes are shown at the seedling stage (E). The [NO3−] S:R ratios in the root and shoot tissues of the two genotypes are shown at the seedling stage (F). Vertical bars on the figures indicate SD (n = 3), different letters at the top of the histogram bars denote significant differences at P < 0.05.

