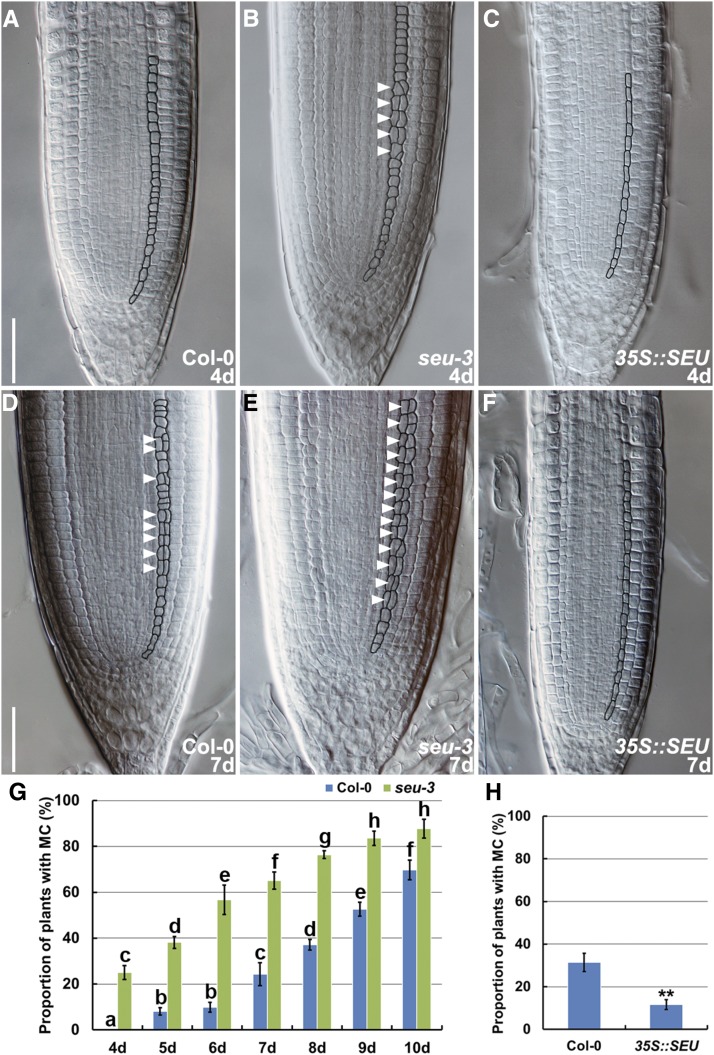
Figure 1.
SEU represses MC formation in the root endodermis. A to F, Occurrence of MC formation in roots of Col-0 (A and D), seu-3 (B and E), and 35S::SEU (C and F) at the indicated time points (4 d or 7 d after sowing). The black outlines and white arrowheads highlight the occurrence of MC formation in the root endodermis. Scale bars = 50 μm. G, Time-course analysis of proportion of plants with MC formation in roots of Col-0 and seu-3 seedlings. Error bars represent sd of three independent experiments (n ≥ 25). Bars with different letters are significantly different at P < 0.05, ANOVA. H, Quantitative analysis of proportion of plants with MC formation in roots of Col-0 and 35S::SEU seedlings 7 d after sowing. Error bars represent sd of three independent experiments (n ≥ 25). **, P < 0.01, Student’s t test.

