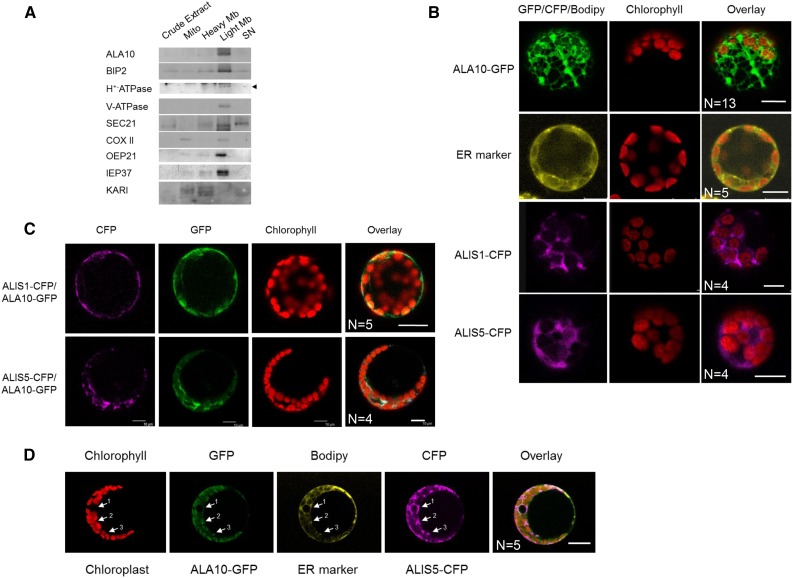
Figure 2.
Analysis of ALA10 and ALIS subcellular localization. A, Western-blot immunodetection of ALA10 in subcellular fractions of Arabidopsis cells. Cell fractionation is described in “Materials and Methods.” The purity of the different fractions was checked by using antibodies against different cell compartment markers: BIP2 (ER), H+-ATPase (plasma membrane), V-ATPase (tonoplast membrane), SEC21 (Golgi apparatus), COXII (mitochondrial inner membrane), OEP21 (chloroplast outer envelope membrane), IEP37 (chloroplast inner envelope membrane), and ketol-acid reductoisomerase (KARI; plastid stroma). Signal at the predicted size for H+-ATPase is indicated by the arrowhead. The mitochondrial inner membrane marker is mostly detected in the mitochondria (Mito) fraction, with a lighter signal in the light membrane (Light Mb) fraction. The stromal marker is mostly detected in the heavy membrane (Heavy Mb) fraction, with additional signals in the mitochondria and supernatant (SN) fractions. B to D, Confocal imaging of protoplasts from Arabidopsis leaves 16 to 28 h after transformation with pUC19:ALA10-GFP, p102:ALIS1-CFP, or p102:ALIS5-CFP (line 1, 3, or 4 respectively) or after 40 min of incubation with the ER marker BODIPY TR Glibenclamide (line 2) in B, with pUC19:ALA10-GFP, p102:ALIS1-CFP, or p102:ALIS5-CFP in C, or with pUC19:ALA10-GFP and p102:ALIS5-CFP and after 40 min of incubation with BODIPY TR Glibenclamide in D. In D, arrows indicate the colocalization of GFP and CFP with the ER marker around the nucleus (arrow 1) and close to chloroplasts (arrows 2 and 3). Green, yellow, and magenta correspond to GFP, BODIPY, and CFP observation, respectively. Red indicates observation of chlorophyll fluorescence, which allows the location of chloroplasts. N, Number of similar images obtained independently. Bars = 10 µm.

