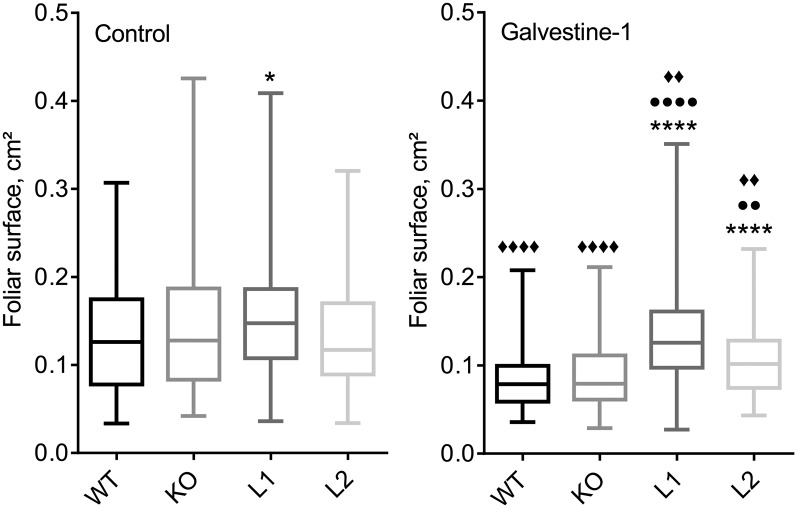
Figure 4.
Growth phenotypes of ALA10 lines under Galvestine-1 treatment. Plants were treated by 0 (control) or 100 µm Galvestine-1 for 15 d (3 d in the dark followed by 12 d in the light). All plants were grown in parallel at 20°C on medium containing 2% Suc and 0.2% Tween 20 and the indicated Galvestine-1 concentrations. The foliar area was measured using ImageJ software. The distribution of data obtained for each line is presented in a box plot with the median as the solid line inside the box, the first and third quartiles as the lower and upper lines of the box, and the minimum and maximum values as the bottom and top ends, respectively. The number of samples was as follows: for control, 78 wild type (WT), 86 KO, 135 L1, and 103 L2; for Galvestine-1, 121 wild type, 122 KO, 132 L1, and 76 L2. Data were compared with the wild type (asterisks) or the KO line (circles) or with the same line in the control without Galvestine-1 (diamonds). Symbols indicate statistically significant differences (Student’s t test, P < 0.01); four symbols indicate P < 0.0001, two symbols indicate P between 0.01 and 0.001, and one symbol indicates P between 0.1 and 0.01.

