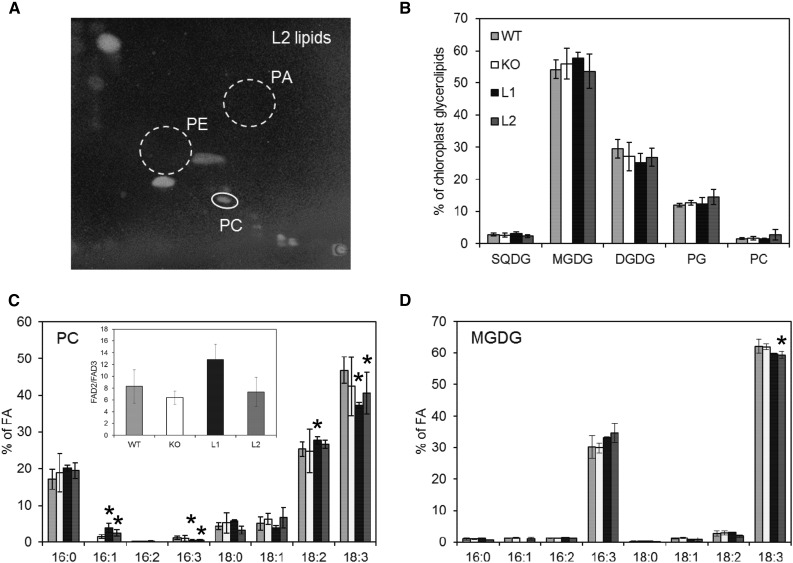
Figure 6.
Lipid composition of chloroplasts isolated from ALA10 lines. A, Two-dimensional thin-layer chromatography (2D-TLC) of chloroplast lipids from the L2 line. Lipids were visualized with 8-anilino-1-naphthalenesulfonic acid. Whereas PC is easily detectable, PE and PA are below the detectable level. B, Glycerolipid composition of chloroplasts. C and D, Fatty acid (FA) profiles of PC and MGDG in chloroplasts from the different mutant lines. The inset in C shows the analysis of FAD2/FAD3 desaturation efficiency as explained in Figure 7D. The different lines were grown on soil at 22°C in the same culture room for 5 weeks but over periods shifted in time in order to get in the available space enough leaf material for the batch isolation of chloroplasts. Each result is the mean ± sd of three to four biological repeats. Asterisks indicate statistically significant differences from the wild type (WT; Student’s t test, P < 0.05).

