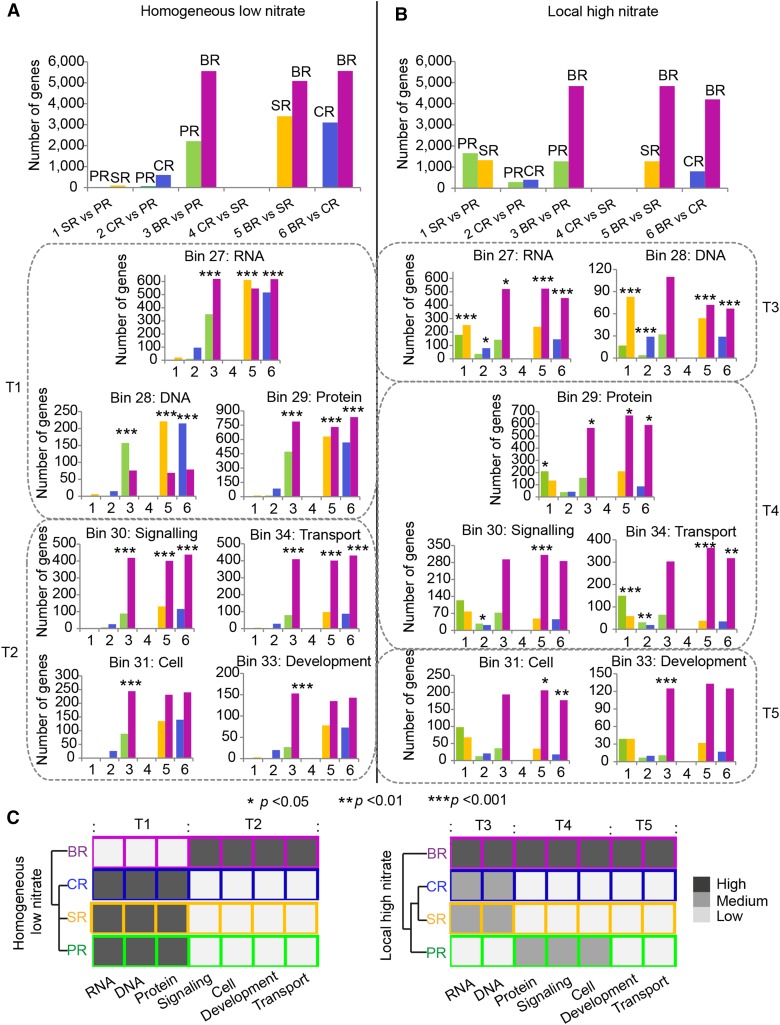
Figure 5.
Preferentially expressed genes and functional distributions in pericycle cells among six pairwise root type comparisons under homogeneous low nitrate (A) and local high nitrate (B) conditions. All genes preferentially expressed in one root type in the six comparisons were mapped to the 35 MapMan bins. The different color-coded columns in each comparison indicate the number of genes preferentially expressed in the corresponding root type. For each pair of root type comparisons (1–6), functional classes in which the ratio of preferentially expressed genes significantly differed from the expected ratio calculated from all differentially expressed genes were combined based on similar trends in classes T1 to T5. *P < 0.05, **P < 0.01, and ***P < 0.001. C, Root type-specific enrichment trends of MapMan classes according to the results of A and B. The hierarchical clustering dendrogram was inferred by applying PCC as distance function. Same fill colors of the squares indicate no relative enrichment of differentially expressed genes in these MapMan bins between root types while darker colors indicate relative enrichment of differentially expressed genes in root types compared to root types with lighter fill colors. PR, primary root; SR, seminal root; CR, crown root; BR, brace root.

