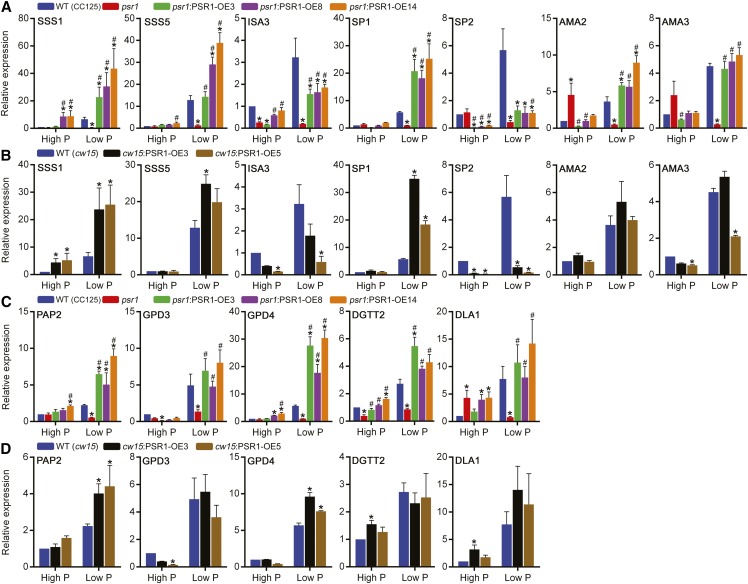
Figure 10.
Altered starch and lipid gene expression in PSR1 overexpression lines. Relative expression of selected starch metabolism genes (A and B) and selected lipid metabolism genes (C and D) in psr1:PSR1 complementation lines is shown compared with the wild type (WT; CC125) and psr1 (A and C) and in overexpression lines compared with the wild type (cw15; B and D) under high-P and low-P conditions at day 3. Expression of the mRNA transcripts by real-time PCR was determined relative to CBLP expression and is shown relative to the high-P-treated wild-type transcript. Each data point represents the mean ± se of three biological replicates each with three technical replicates. Asterisks denote significant differences (P < 0.05) from wild-type values and pound signs denote significant differences (P < 0.05) from psr1 values, both as determined by one-way ANOVA.

