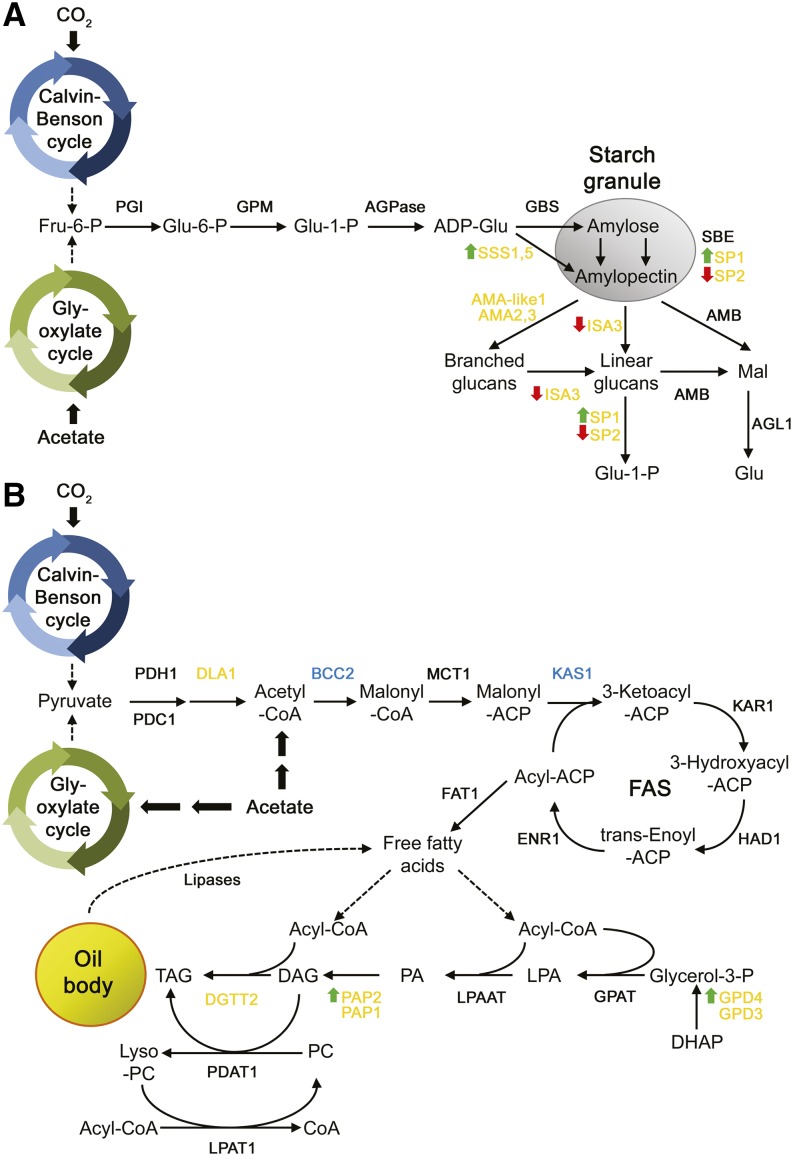
Figure 11.
Model of the effects of PSR1 overexpression on starch and lipid metabolism. The schematic diagrams represent starch synthesis and breakdown (A) and fatty acid and TAG synthesis (B). Genes in yellow and blue are those up-regulated and down-regulated by P starvation, respectively, as determined by real-time PCR. For gene definitions, see Supplemental Table S1. Green up arrows and red down arrows indicate genes that are positively or negatively regulated by PSR1 overexpression, respectively.

