Figure 3.
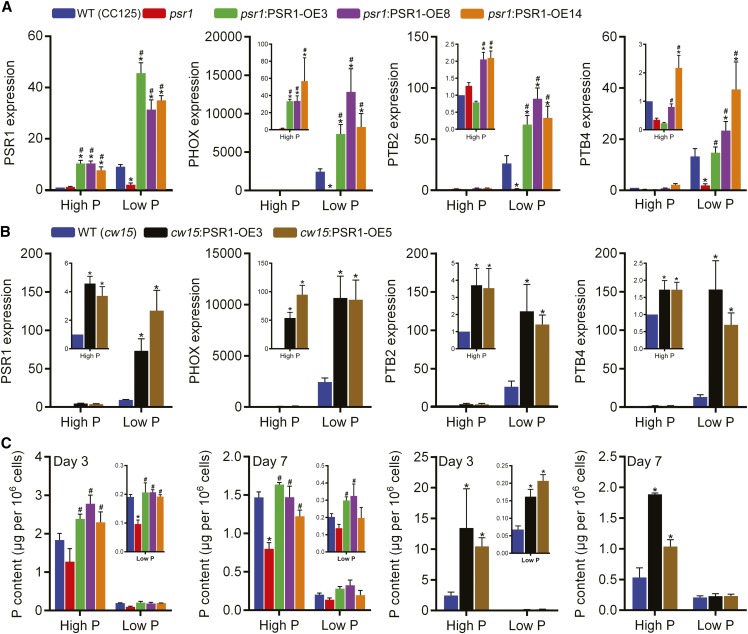
Altered P homeostasis in PSR1 overexpression lines. A and B, Relative expression of PSR1 was quantified in psr1:PSR1 complementation lines compared with the wild type (WT; CC125) and psr1 (A) and in overexpression lines compared with the wild type (cw15; B) under high-P and low-P conditions at day 3. The relative expression of known PSR1-dependent, low-P-induced P homeostasis genes (PHOX, PTB2, and PTB4) was quantified in psr1:PSR1 complementation lines (A) and overexpression lines (B). Expression of the mRNA transcripts by real-time PCR was determined relative to CBLP expression and is shown relative to high-P-treated wild-type transcript. C, Pi accumulation in psr1:PSR1 complementation lines and overexpression lines compared with the wild type and psr1 in high-P and low-P conditions. Cellular Pi concentrations at days 3 and 7 are shown. Each data point represents the mean ± se of three biological and technical replicate culture flasks and is representative of three independent experiments. Asterisks denote significant differences (P < 0.05) from wild-type values and pound signs denote significant differences (P < 0.05) from psr1 values, both as determined by one-way ANOVA.

