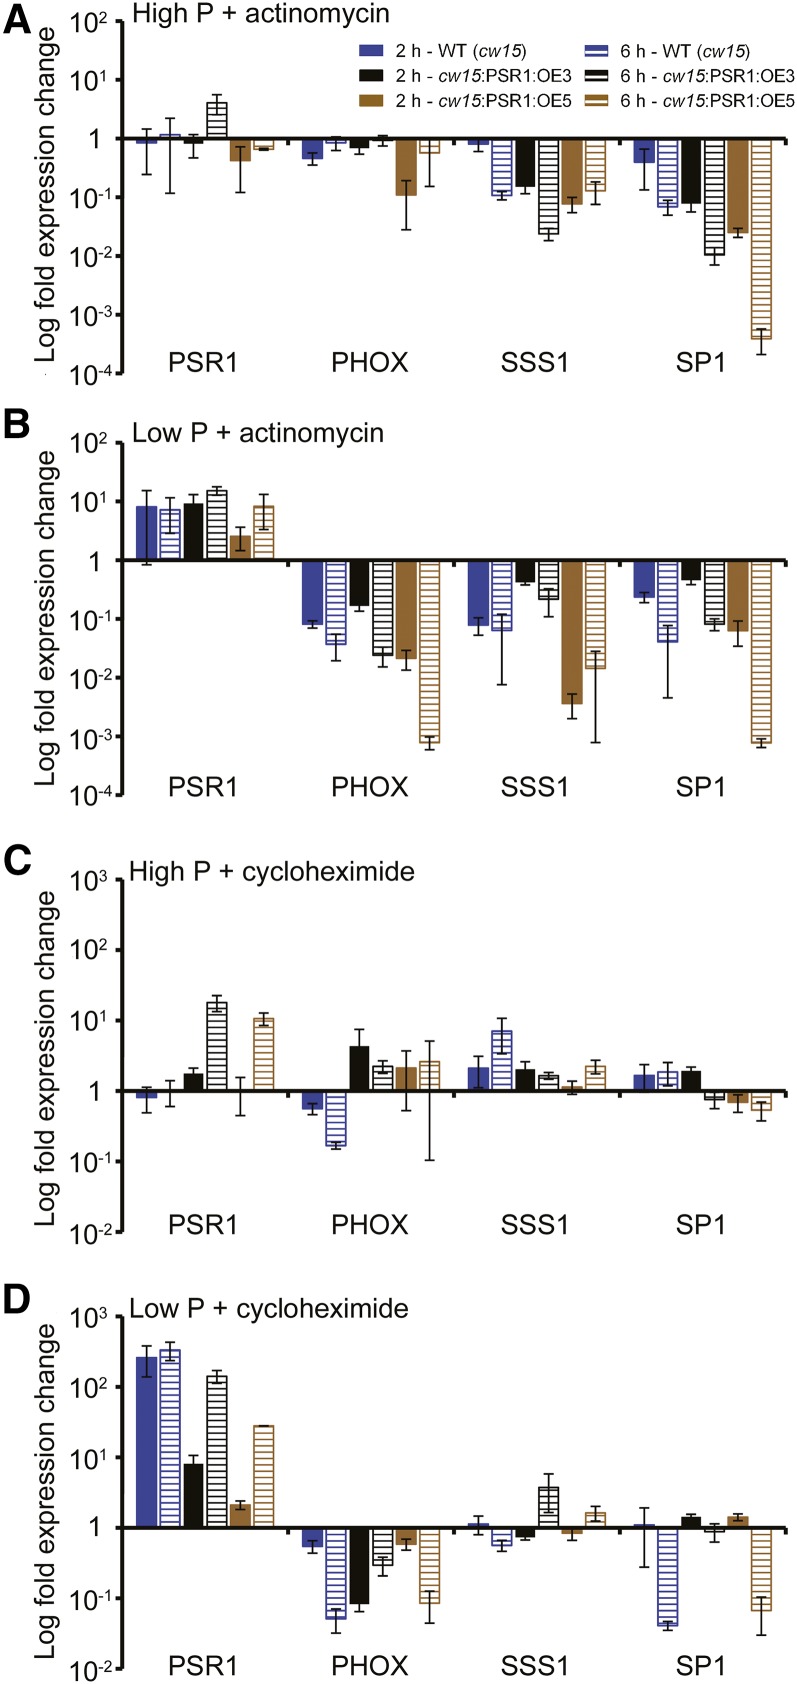
Figure 4.
Effect of actinomycin D and cycloheximide treatment on transcript abundance in PSR1 overexpression lines. Change in expression is shown for PSR1, PHOX, SSS1, and SP1 in PSR1 overexpression lines and the wild type (WT; cw15) at day 3 following treatment for 2 h (solid bars) and 6 h (hatched bars) with the transcription inhibitor actinomycin D during high-P (A) and low-P (B) growth and with the translation inhibitor cycloheximide during high-P (C) and low-P (D) growth. Expression of the mRNA transcripts by real-time PCR was determined relative to CBLP expression, and the increase or decrease in transcript abundance is shown relative to expression without inhibitor treatment. Each data point represents the mean ± se of three biological and technical replicate culture flasks.

