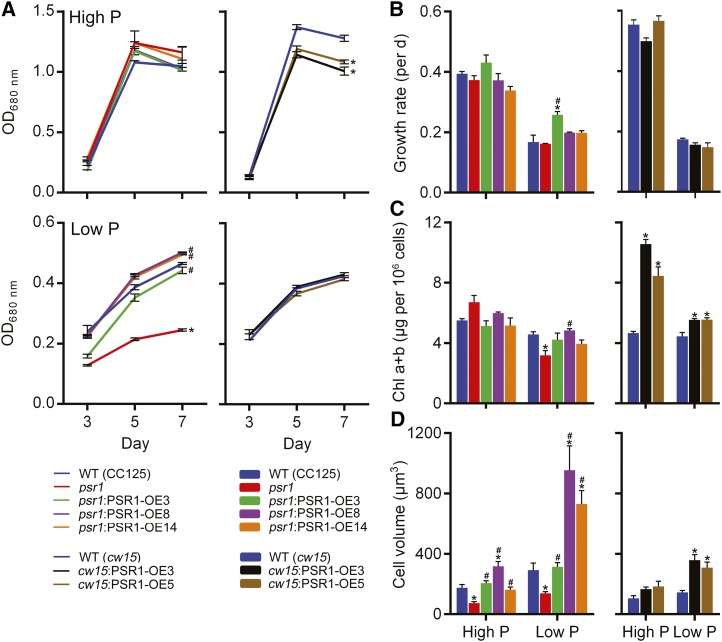
Figure 5.
Changes in the physiology of PSR1-expressing cells in response to P starvation. Cell density determined by optical density at 680 nm (OD680nm) measurement (A) and specific growth rate determined at exponential phase from optical density at 680 nm values (B), total chlorophyll (Chl a+b; C), and biovolume (D) of PSR1 overexpression lines are shown. Chlorophyll and biovolume were quantified at day 7. Each data point represents the mean ± se of three replicates each with three technical replicates and is representative of three independent experiments. Asterisks denote significant differences (P < 0.05) from wild-type (WT) values and pound signs denote significant differences (P < 0.05) from psr1 values, both as determined by one-way ANOVA.

