Figure 6.
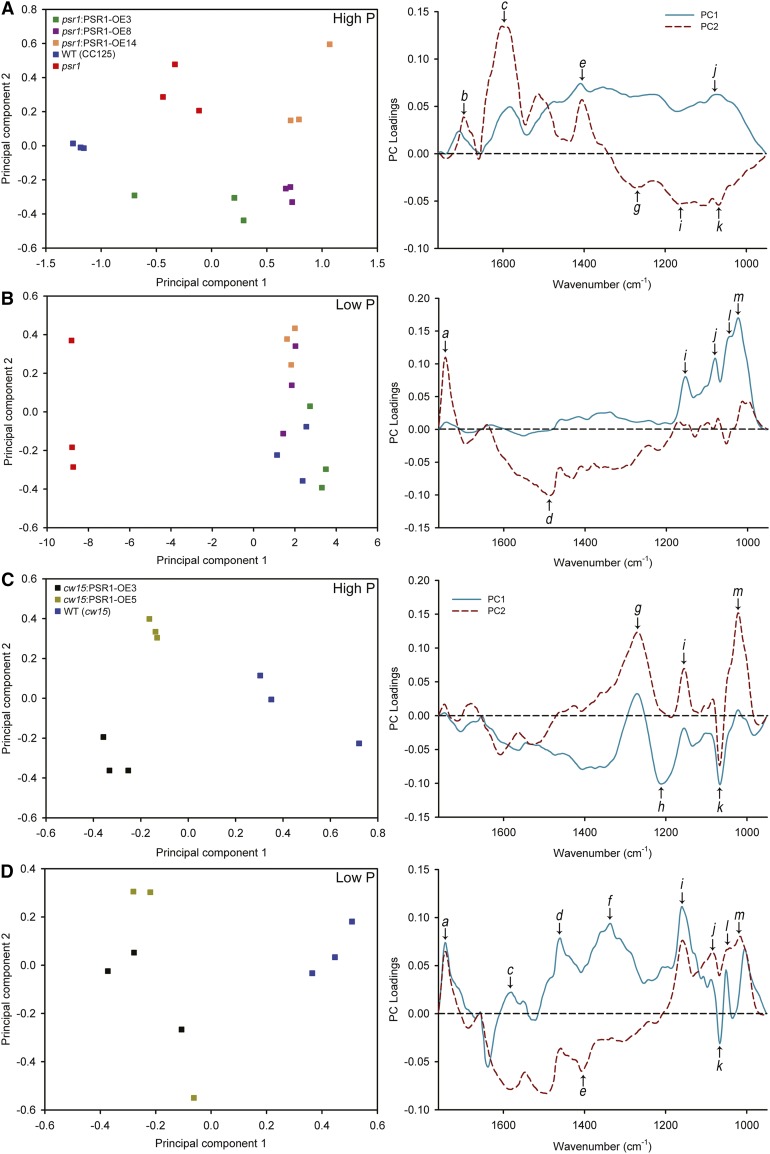
FT-IR spectroscopy analysis of PSR1 expression lines. Principal component analysis scores (left) and principal component (PC) loading plots (right) are shown for FT-IR spectra from the wild type (WT; CC125), psr1, and psr1:PSR1 complementation lines (A and B) and wild-type (cw15) and PSR1 overexpression lines (C and D) under high-P (A and C) and low-P (B and D) conditions. Analysis was performed on three replicate spectra for each sample and treatment. Selected bands that show strong changes are highlighted on the loading plots: a, νC=O of ester functional groups from lipids and fatty acids; b, νC=O of amides associated with protein (amide I); c, δ N-H of amides associated with protein (amide II); d, δas CH3 and δas CH2 of lipids and proteins; e, δas CH3 and δas CH2 of proteins, νsC-O of carboxylic groups; f, unknown; g, νasP=O of nucleic acids, phosphoryl group, due to DNA/RNA backbones, phosphorylated proteins, and polyphosphate storage products; h, νC-O-C of polysaccharides; i, νC-O of carbohydrates; j, νC-O of carbohydrates; k, νC-O-C of carbohydrates; l, νC-O of carbohydrates; m, νC-O of carbohydrates.

