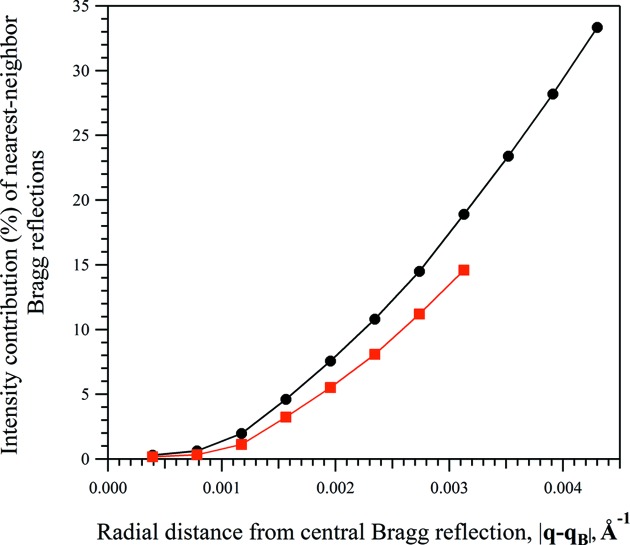
Figure 4.
The percentage contribution of nearest-neighbour Bragg reflections to the total modelled intensity distribution of the (980) Bragg reflection [|F WPF(980)| = 555.6, |F C(980)| = 551.1]. The percentage contribution was calculated as the percentage of the intensity distribution modelled by the surrounding Bragg reflections [the second term of equation (10)] relative to the total intensity modelled at radial distances from the Bragg position of the (980) reflection. The analysis was performed on two merged diffraction patterns generated from a collection of 2000 nanoscale crystals of the test protein with different mean unit-cell dimensions along the Y direction and with a mean of 10 unit cells along the X direction, 〈NX〉 = 10: (black, circles) 〈NY〉 = 30, (red, squares) 〈NY〉 = 60.

