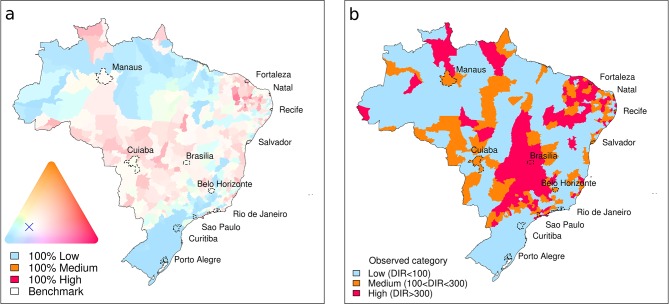
Figure 2. Probabilistic dengue forecast and observed dengue incidence rate categories for Brazil, June 2014.
(a) Probabilistic dengue forecast for June 2014. The continuous colour palette (ternary phase diagram) conveys the probabilities assigned to low-risk, medium-risk, and high-risk dengue categories. Category boundaries defined as 100 cases per 100,000 inhabitants and 300 cases per 100,000 inhabitants. The greater the colour saturation, the more certain is the forecast of a particular outcome. Strong red shows a higher probability of high dengue risk. Strong blue indicates a higher probability of low dengue risk. Colours close to white indicate a forecast similar to the benchmark (long-term average distribution of dengue incidence in Brazil, June, 2000–2013: pL=68%, pM=16%, pH=16%), marked by a cross. (b) Observed dengue incidence rate (DIR) categories for June, 2014.

