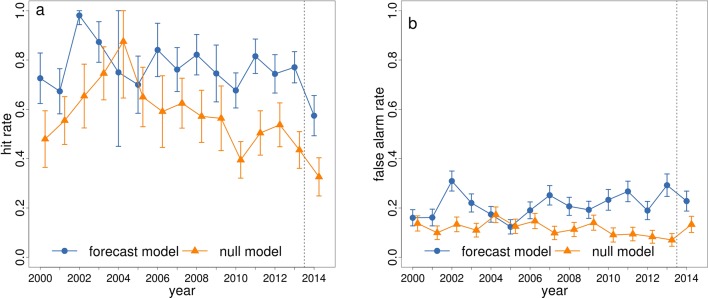
Figure 5. Hit rate and false alarm rate for predicting dengue in the high risk category for June 2000–2014 using the forecast model and null model.
Comparison of (a) hit rates and (b) false alarm rates for the event of observed DIR exceeding the high risk epidemic threshold (300 cases per 100,000 inhabitants) using the probabilistic category forecast model (blue circles) and the null model (orange triangles) for June 2000–2014. The vertical bars around each point represent the 95% confidence intervals. The vertical dotted line separates the leave-one-out cross validation results (2000–2013) from the true predicted results for 2014.

