. 2016 Jan 29;5:e12556. doi: 10.7554/eLife.12556

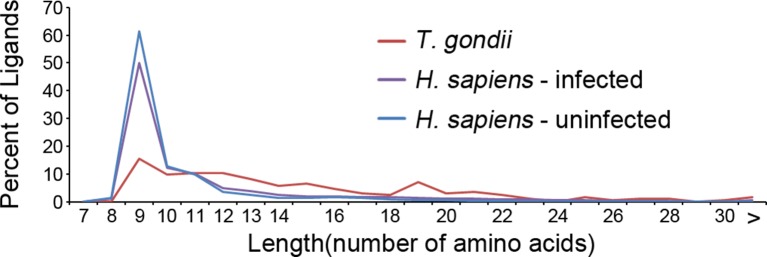
Figure 5. Length distribution of identified ligands.

Figure 5.

Length distributions of unambiguous T. gondii ligands (red), H. sapiens ligands from infected THP-1 cells (purple) and, H. sapiens ligands from uninfected THP-1 cells (blue).

DOI: http://dx.doi.org/10.7554/eLife.12556.009

Figure 5—source data 1. PEAKS export file containing HLA-A*02:01 peptide T. gondii derived ligands from T. gondii infected THP-1 cells.
This is the underlying data for Figures 2, 3, 4, 5, and 6.
DOI: 10.7554/eLife.12556.010
Figure 5—source data 2. PEAKS export file containing HLA-A*02:01 peptide H. sapiens derived ligands from T. gondii infected THP-1 cells.
This is the underlying data for Figures 4, 5, and 6.
DOI: 10.7554/eLife.12556.011