. 2016 Jan 14;5:e12435. doi: 10.7554/eLife.12435

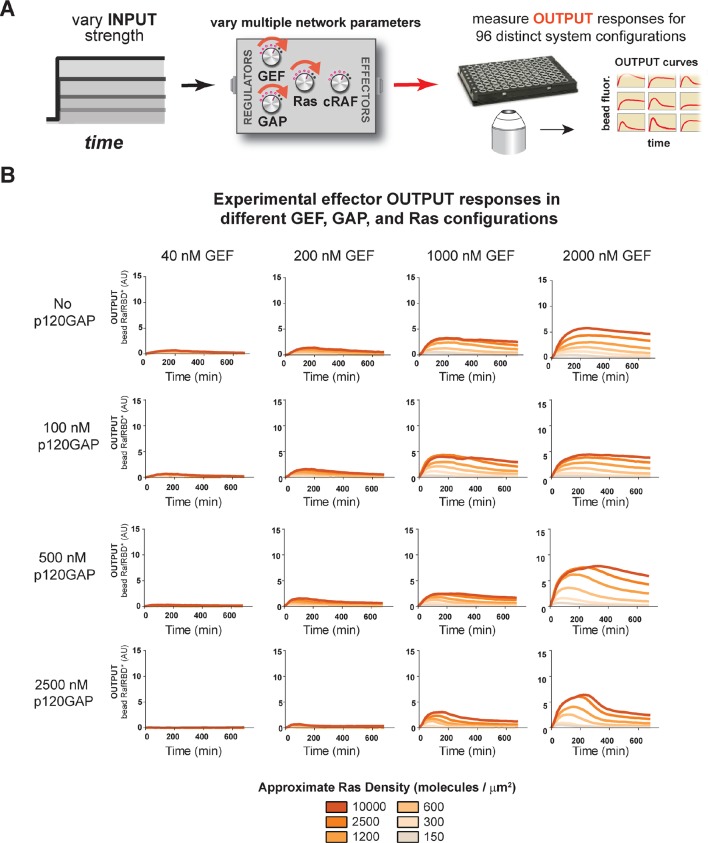
Figure 5. Tuning the levels of GEF, GAP, and GTPase provide access to a rich and diverse space of possible Ras signal processing behaviors.

(A) Depiction of the experimental setup: four different inputs (changes in apparent GEF activity) are applied to a panel of Ras signaling systems sampling four different p120GAP concentrations, and six different Ras densities resulting in experimentally determined output responses for 96 different system configurations. (B) Experimentally determined absolute effector OUTPUT responses across 96 different system configurations. Each graph corresponds to a particular GEF/GAP configuration, and each of the curves within that plot corresponds to a different Ras density as indicated by the color of the curve. GAP, GTPase-activating protein; GEF, guanine exchange factor.

DOI: http://dx.doi.org/10.7554/eLife.12435.012

Figure 5.

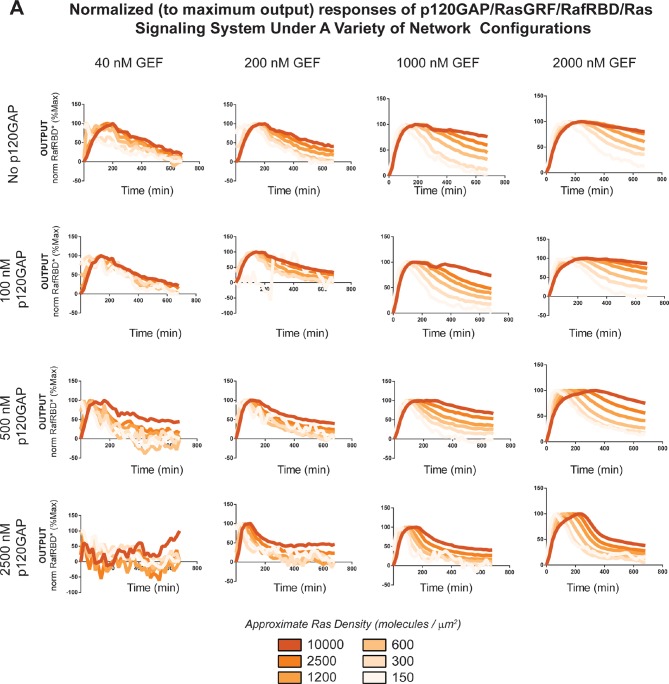
Figure 5—figure supplement 1. Normalized (to maximum output) responses of p120GAP/RasGRF/RafRBD/Ras signaling system under a variety of network configurations.

Figure 5—figure supplement 1.

Normalized (to the maximum output value of the response) signaling responses for different network GEF/GAP/Ras density configurations. The RasGRF catalytic domain was used as the activating GEF in these experiments. The p120GAP catalytic domain was used as the GAP in these experiments; 50 nM cRaf-RBD was used as the effector in these experiments. The response for differing densities of Ras in each GEF/GAP configuration is shown by different color lines in each plot, with estimated densities indicated in the key. GAP, GTPase-activating protein; GEF, guanine exchange factor; RBD, Ras-binding domain.
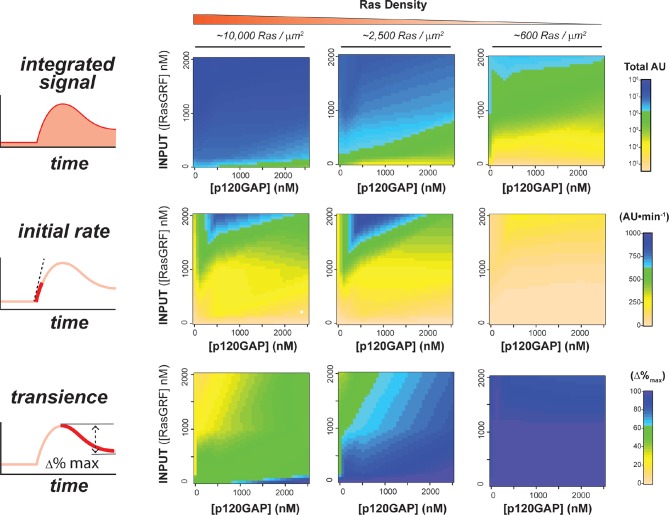
Figure 5—figure supplement 2. Structure of RasGRF/p120GAP/H-Ras/cRaf response space determined from outputs of 96 system configurations.

Figure 5—figure supplement 2.

Phase diagrams for three different output features – integrated signal, initial rate of response, and overshoot behavior – at three different Ras density levels, constructed by interpolating these output features from the 96 responses shown in Figure 5B.
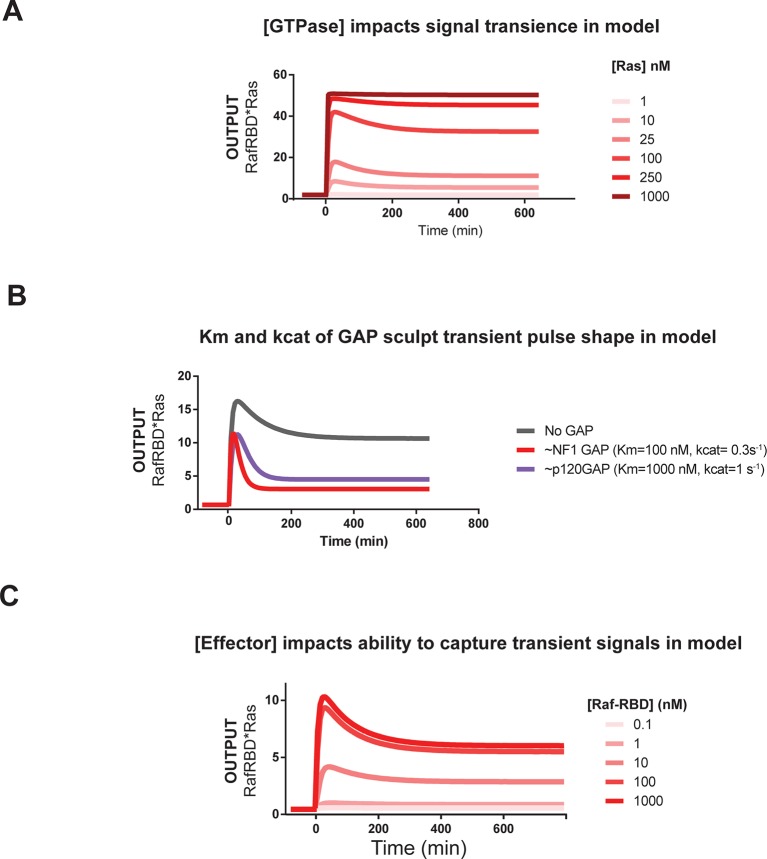
Figure 5—figure supplement 3. Kinetic modeling and simulations are consistent with experimental observations about how system behavior is influenced by network configuration.

Figure 5—figure supplement 3.

(A) Output of Kintek simulation using a three-state GTPase model with competition between GAP and effectors as described in the main-text 'Materials and methods', in which the Ras density (i.e. concentration in this model) is varied over four orders of magnitude as indicated. Initial conditions were 50 nM effector, 1 μM GEF, no GAP, and 'infinite' nucleotide (100000 nM). The model recovers the observation that at low densities, more transient behavior is observed than at high Ras densities, which show a more associative response. (B) Output of Kintek simulation using a three-state GTPase model with competition between GAP and effectors as described in the main-text 'Materials and methods', in which GAP parameter choices that resemble the NF1-GAP (koff = 0.01 s-1, kcat = 0.1 s-1) or p120GAP (koff = 0.25 s-1, kcat = 0.4 s-1) are used. Initial conditions were 50 nM effector, 10 nM Ras, 1 μM GEF, 1 μM GAP, and 'infinite' nucleotide (100000 nM). This model recovers the observation that differences in Km and kcat can result in equivalent amounts of NF1gap and p120GAP producing different transient behaviors in the system output. (C) Output of Kintek simulation using a three-state GTPase model with competition between GAP and effectors as described in the main-text Materials and methods, in which effector concentrationsare varied over 5 orders of magnitude. Initial conditions were 10 nM Ras, 1 μM GEF, no GAP, and 'infinite' nucleotide (100000 nM). This model recovers the observation that higher effector concentrations allow more transient features of the time-varying GTPase signal to be captured in the system output. GAP, GTPase-activating protein; GEF, guanine exchange factor.