
Figure 3. Many tumor types show depletion of mtDNA in tumor samples, relative to adjacent normal tissue.
Normalized histograms and density plots illustrate log2 ratio of mtDNA content in tumor tissue, to mtDNA content in normal tissue. Each row is a different tumor type. Statistical significance of trends is assessed using a Wilcoxon sign rank test, and p-values are corrected using the Benjamini-Hochberg procedure. Cancer types displaying significant depletion/accumulation of mtDNA are colored in blue/red. Seven of fiteen tumor types show a significant depletion of mtDNA content (a shift of the distribution to the left of the dashed line), relative to normal tissue. One tumor type, lung adenocarcinomas, shows an increase in mtDNA content, relative to normal tissue.
DOI: http://dx.doi.org/10.7554/eLife.10769.006
Figure 3—source data 1. Correlation of mtDNA copy number with ESTIMATE (Yoshihara et al., 2013) stromal and immune scores.
Third column indicates whether tumor mtDNA content or log ratio of tumor to normal mtDNA content was used. p-values are uncorrected for multiple hypothesis testing.
elife-10769-fig3-data1.zip (22.1KB, zip)
DOI: 10.7554/eLife.10769.007
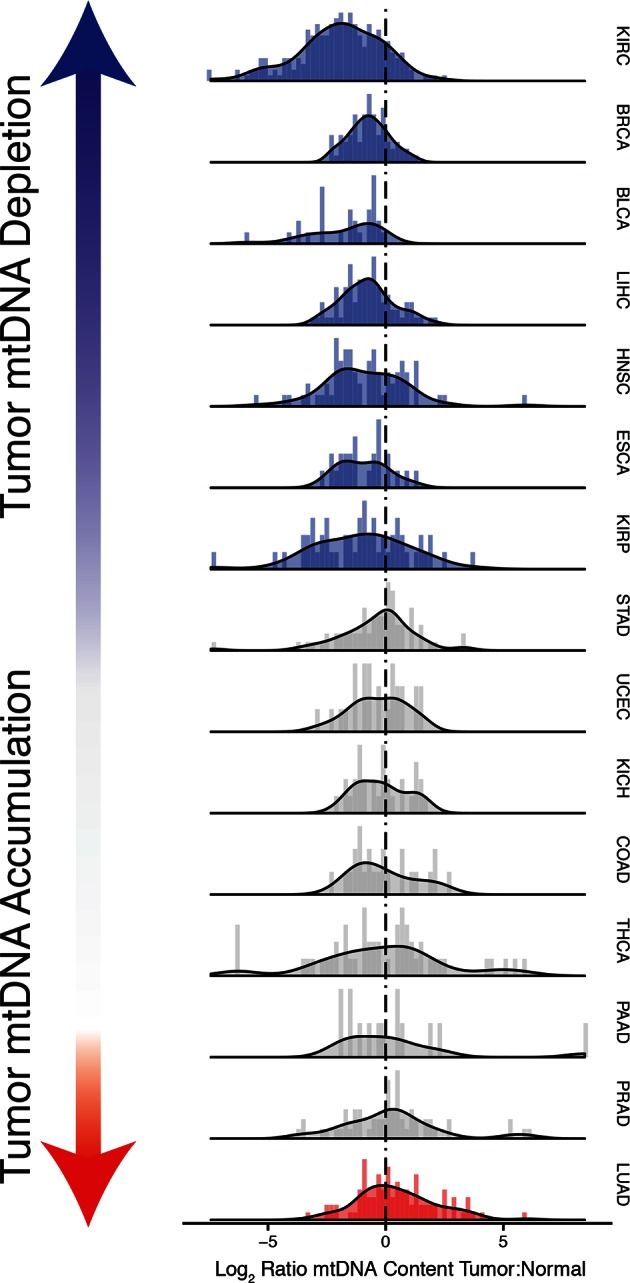
Figure 3—figure supplement 1. mtDNA tumor:normal copy number ratio using whole-genome sequencing (WGS) data.
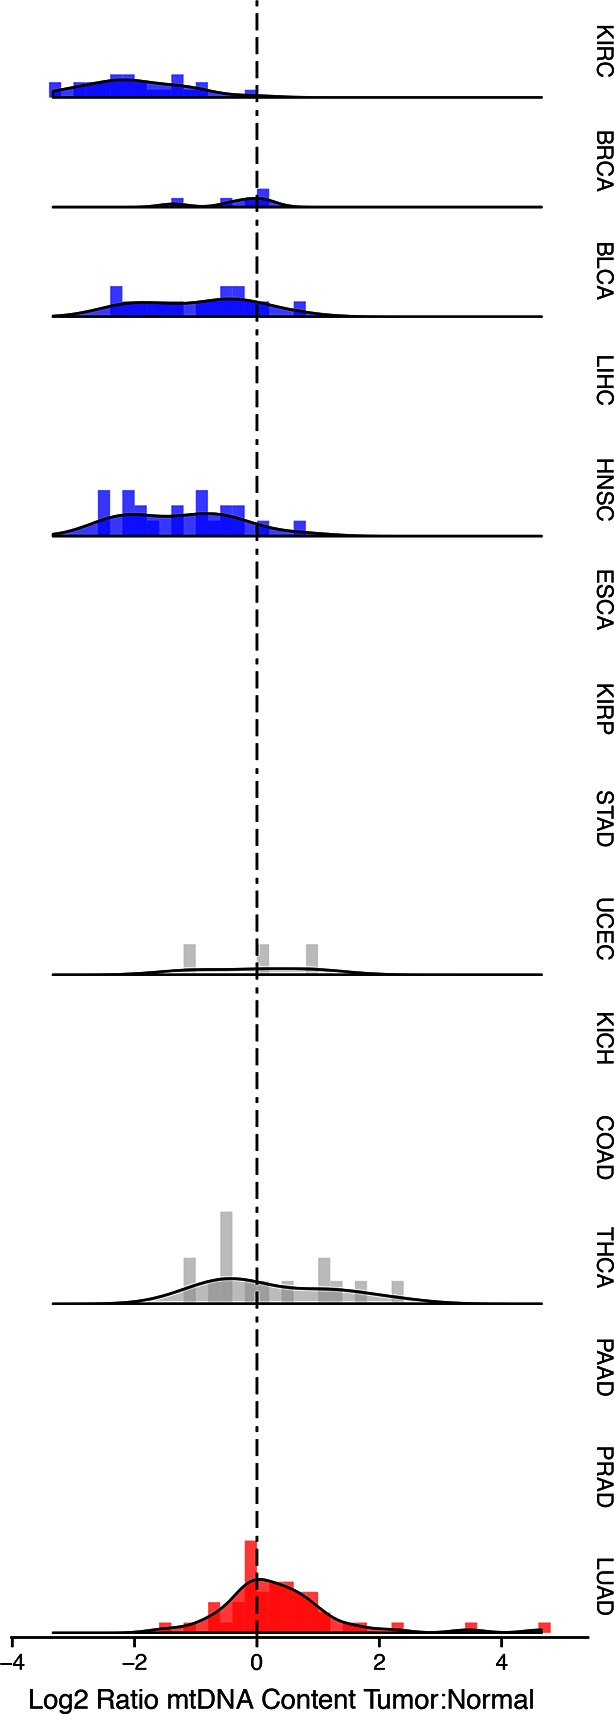
Trends in WGS are in agreement with those in Figure 2 in whole exome sequencing (WXS). All data for this figure can be found in Figure 3—source data 1.
Figure 3—figure supplement 2. Correlation between tumor mtDNA copy number and ESTIMATE immune scores.

Figure 3—figure supplement 3. Correlation between tumor mtDNA copy number and ESTIMATE stromal scores.

Figure 3—figure supplement 4. Correlation between tumor/normal mtDNA copy number ratio and ESTIMATE immune scores.

Horizontal line indicates a log ratio of zero (i.e., tumor and normal tissue have identical copy number).
Figure 3—figure supplement 5. Correlation between tumor/normal mtDNA copy number ratio and ESTIMATE stromal scores.

Horizontal line indicates a log ratio of zero (i.e., tumor and normal tissue have identical copy number).