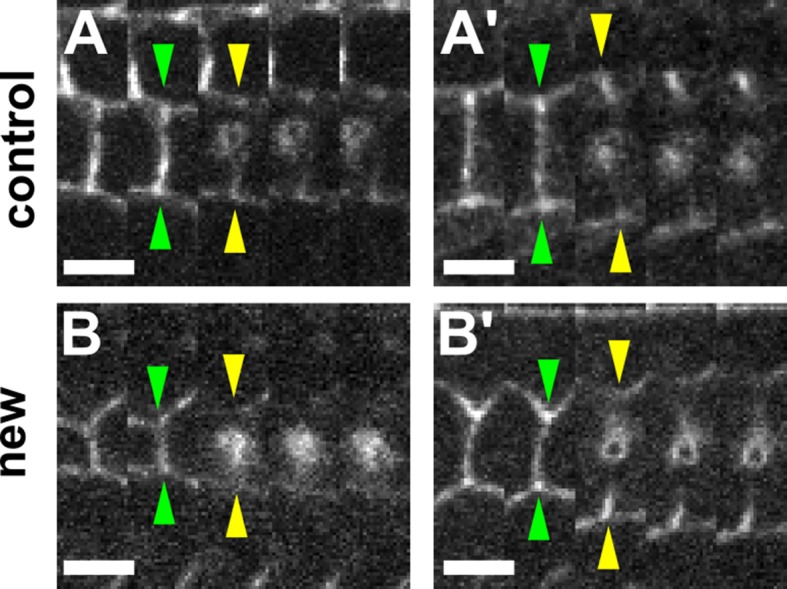
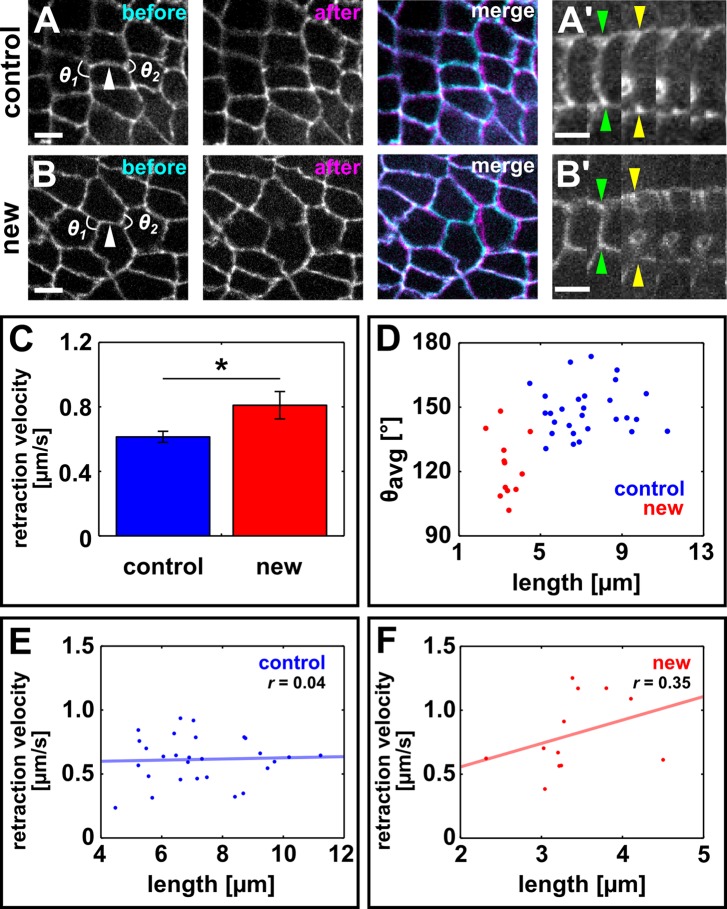
Figure 2. Resolving edges sustain increased mechanical tension during axis elongation.
(A, B) Germband cells expressing E-cadherin:GFP before and after ablation of a control DV edge (A) or a newly forming DV edge (B). White arrowheads point to the ablated interface. θ1 and θ2indicate the angles between the junctions anterior and posterior to the ablated interface, respectively. Anterior left, dorsal up. Scale bars, 5 µm. (A’, B’) Kymographs showing the vertex displacement caused by laser ablation of the edges shown in (A, B). Arrowheads indicate vertex position prior to ablation (green) or immediately after (yellow). Interfaces are rotated by 90° with respect to (A, B) Anterior down, dorsal left. Scale bar, 3 s. (C) Retraction velocity after laser ablation in control (blue, n = 28) and new (red, n = 12) DV interfaces. Asterisk indicates p = 0.05. Error bars, s.e.m. (D) Scatterplot showing interface length vs. average junction angle at the anterior and posterior ends (θavg= (θ1+θ2)/2). (E, F) Scatterplots showing interface length vs. retraction velocity after laser ablation for control (E) and new (F) DV interfaces. Solid lines are best-fit lines. DV, dorsal-ventral.
Figure 2—figure supplement 1. The retraction velocity after ablation of new and control DV edges is not anti-correlated with their length.


