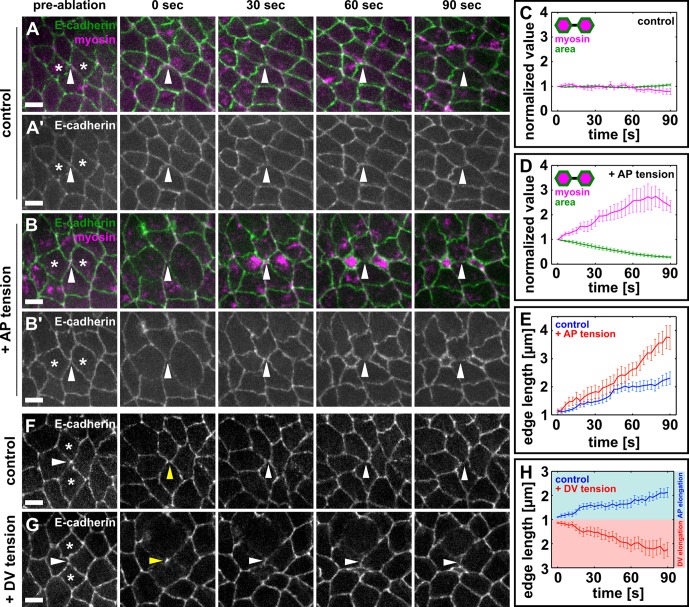
Figure 4. Local mechanical tension is sufficient to promote and orient new interface assembly during vertex resolution.
(A–B') Cells expressing E-cadherin:GFP (green) and myosin:mCherry (magenta) in sham (A) or UV-irradiated (B) embryos. (C, D) Medial myosin intensity (magenta) and cell area (green) in sham (C, n = 22 cells in 11 embryos) and UV-irradiated embryos (D, n = 16 cells in 8 embryos). (E) Length of resolving DV interfaces over time in controls (blue, n = 11 interfaces) and under increased tension along the AP axis (red, n = 8 interfaces). (F, G) Cells expressing E-cadherin:GFP in sham (F) or UV-irradiated (G) embryos. Asterisks show the cells around a four-cell vertex (white arrowheads) that were irradiated. Yellow arrowheads indicate the formation of a four-cell vertex. (A, B, F, G) Anterior left, dorsal up. Scale bars, 5 µm. (H) Length of resolving interfaces over time in controls (blue, n = 12) and under increased tension along the DV axis (red, n = 13). Turquoise indicates elongation parallel to the AP axis, pink denotes DV elongation. (C–E, H) Time is with respect to the time point when the nascent DV interface first exceeded 1 µm in length. Error bars, s.e.m. (C, D) Normalization is with respect to the value at 0 s. AP, anterior-posterior; DV, dorsal-ventral.


