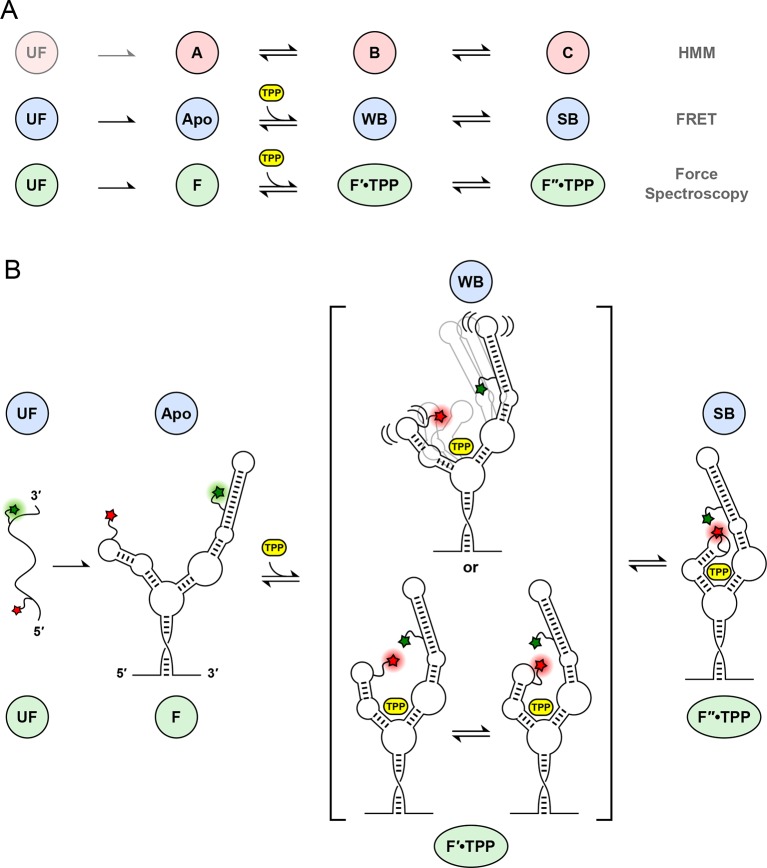
Figure 7. Correspondences among single-molecule state identifications, and model of aptamer binding to TPP.
(A) Cartoon summarizing the correspondence between analysis and data collection methodologies. The corresponding states and reaction schemes obtained from HMM analysis (top line; pink circles), helix-arm configuration states obtained from FRET signals (middle line; blue circles), and secondary structural states inferred from force spectroscopy (lower line; green ellipses) are shown. (B) Model for ligand binding and associated conformational changes. Colored labels indicate states based on aptamer secondary structure (green circles and ellipses; derived from force data) and sensor-helix arm configuration (blue circles; derived from FRET data). Prior to TPP binding, the sensor arms are apart. Subsequent to TPP binding, the arms remain mobile but begin to move closer together in the weakly-bound, liganded state. This mobility may reflect a type of conformational heterogeneity that is either dynamic (top), with flexible arms, or static (bottom), with rapid interconversions between transient states (square brackets; see text). The system subsequently transitions, on a timescale of around a second, to a strongly bound state, with the sensor arms fully docked and largely immobilized.

