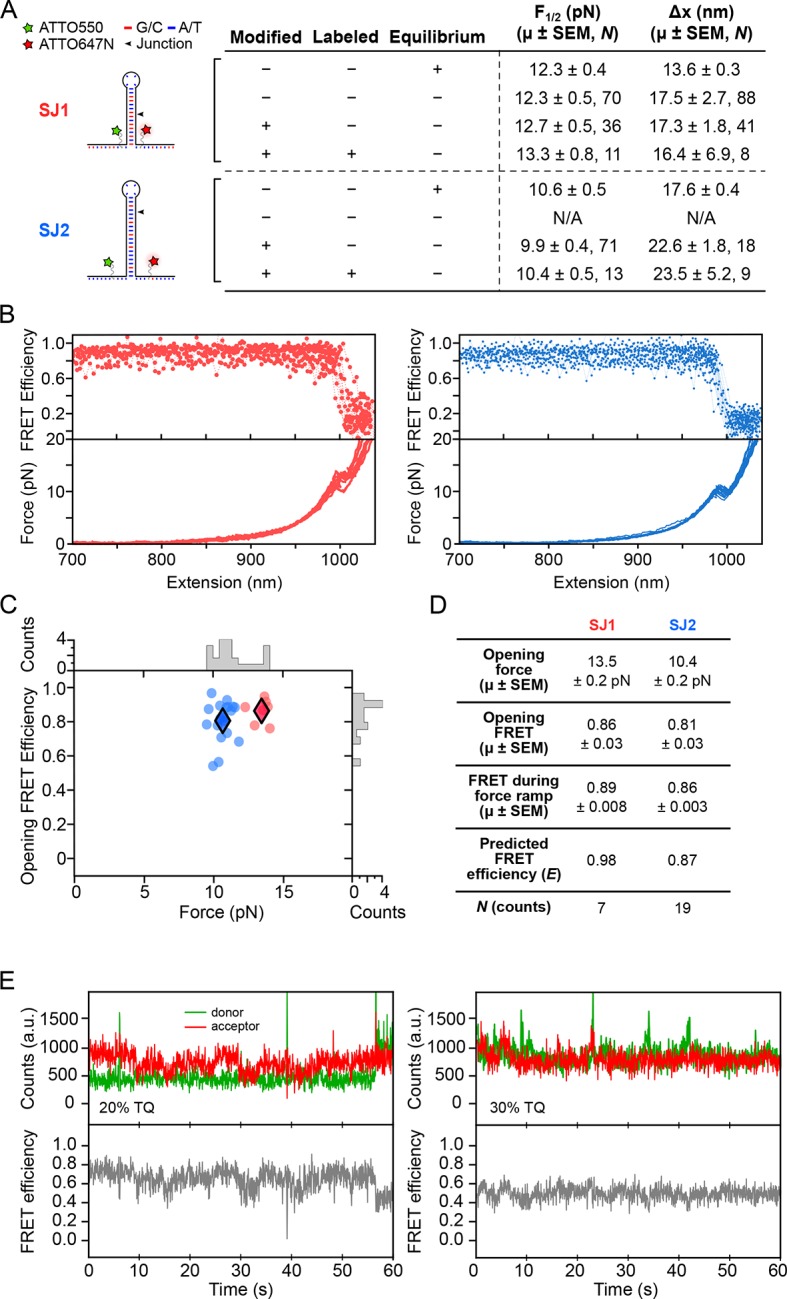
Figure 8. Dye characterization using DNA hairpins.

(A) Opening distances (F1/2) and forces (Δx) of DNA hairpins SJ1 and SJ2 were measured at non-equilibrium and compared to previous measurements at equilibrium. (B) FRET trajectories and FECs are shown. (C) k-means clustering for SJ1 and SJ2 FRET trajectories. Cluster means are indicated with filled diamonds. (D) Table summarizing opening force and FRET statistics, force ramp FRET statistics, plus predicted FRET efficiency. (E) Donor and acceptor traces (top) in the presence of 20 and 30% TQ (left and right, respectively).
