. 2016 Jan 5;5:e10483. doi: 10.7554/eLife.10483

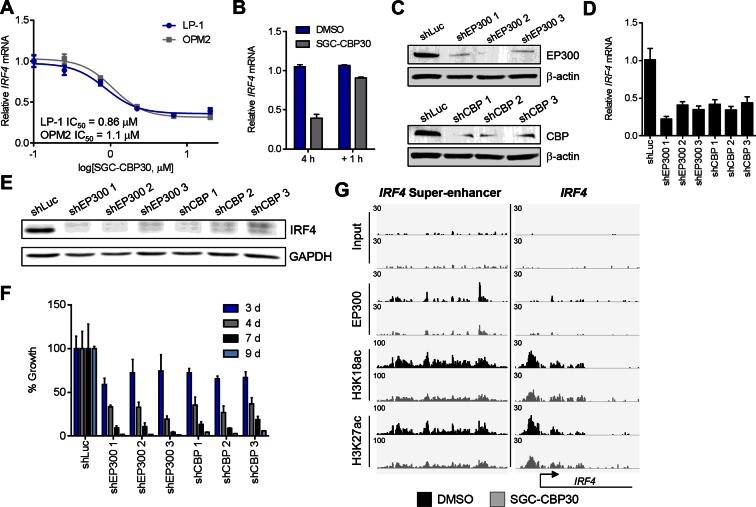
Figure 4. IRF4 is a direct transcriptional target of CBP/EP300 bromodomain inhibition.

(A) Dose-dependent inhibition of IRF4 mRNA expression (qRT-PCR) with SGC-CBP30 in LP-1 and OPM2 cells following 6 hr of treatment. Values represent the mean of three biological replicates, ± SEM. (B) LP-1 cells were treated with SGC-CBP30 (2.5 μM) for 4 hr, compound was removed, and cells were incubated for an additional 1 hr in fresh media. Levels of IRF4 mRNA were measured by qRT-PCR and normalized to GAPDH. Relative mRNA values normalized to DMSO at each time point represent the mean of 2 biological replicates, ± SEM. (C) Cells were transduced with lentivirus and lysed for Western analysis with the indicated antibodies (3 days post-infection). (D) IRF4 expression was determined by qRT-PCR at 3.5 days following the transduction of shRNA lentivirus, and mRNA was normalized to GAPDH and expressed relative to the control shLuc (n = 3 technical replicates, ± SEM). (E) Western analysis with the indicated antibodies was carried out at 3.5 days post-transduction with the indicated shRNA constructs. (F) Cells were fixed at the indicated time points following transduction and viability was determined by flow cytometry. Percent growth is expressed relative to control shLuc at each time point. Values represent the mean of n = 3 technical replicates, ± SEM. (G) LP-1 cells were treated with SGC-CBP30 (2.5 μM) for 6 hr, and the indicated antibodies were used for ChIP-seq. Sequencing traces for the IRF4 super-enhancer and the transcriptional start site are shown. See Figure 4—figure supplements 1 and 2 for additional supporting data.

DOI: http://dx.doi.org/10.7554/eLife.10483.010

Figure 4.

Figure 4—figure supplement 1. CBP/EP300 bromodomain inhibition regulates the expression of IRF4.

Figure 4—figure supplement 1.

(A) Cells were treated with I-CBP112 for 6 hr, and levels of IRF4 were determined as in Figure 4A. Values represent the mean of n = 3 biological replicates ± SEM. (B) LP-1 cells were treated with a titration of CPI203 for 6 hr, and IRF4 expression was determined by qRT-PCR and normalized to GAPDH. Values represent the mean of n = 2 biological replicates, ± SEM. (C) LP-1 cells were treated with DMSO, SGC-CBP30 (2.5 μM), or I-CBP112 (5 μM). Total RNA was prepared at the indicated time points and used for qRT-PCR. Expression of IRF4 was normalized to GAPDH and calculated relative to DMSO treated cells at each time point. Values represent the mean of n = 4 technical replicates, ± SEM. (D) Uninduced LP-1/IRF4 cells were treated with SGC-CBP30 (2.5 μM) or I-CBP112 (5 μM) for 24 hr, and lysates were prepared for Western analysis with the indicated antibodies. (E) LP-1 cells were treated with the indicated concentrations of SGC-CBP30 for 16 hr, and extracts were prepared for Western analysis with the indicated antibodies.
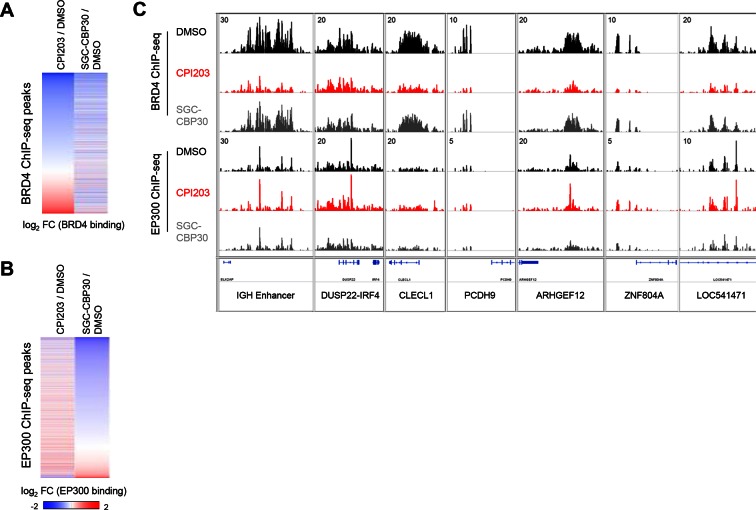
Figure 4—figure supplement 2. CBP/EP300 bromodomain inhibition does not cause global eviction of BRD4 from chromatin.

Figure 4—figure supplement 2.

(A) BRD4 ChIP-seq peaks were called using MACS and ranked by log2 fold change in BRD4 enrichment in LP-1 cells treated for 6 hr with 0.25 µM CPI203 compared to DMSO-treated cells. (B) EP300 ChIP-seq peaks were called using MACS and ranked by log2 fold change in EP300 enrichment in LP-1 cells treated for 6 hr with 2.5 µM SGC-CBP30 compared to DMSO-treated cells. (C) Examples of BRD4 and EP300 ChIP-seq tracks showing that CBPi does not cause global eviction of BRD4, and that BETi does not globally reduce EP300 chromatin binding. Representative tracks of two biological replicates are shown.