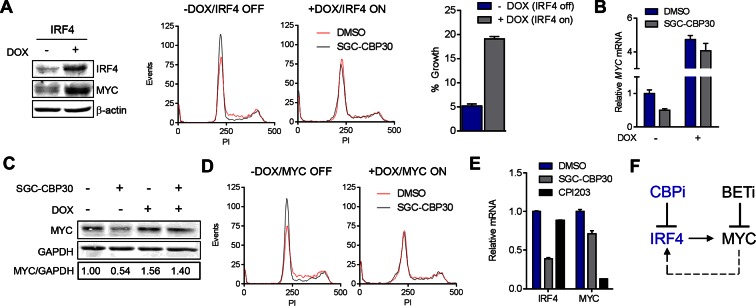
Figure 6. CBP/EP300 bromodomain inhibition suppresses the IRF4/MYC axis to cause viability defects.
(A) IRF4 expression was induced in the LP1/IRF4 cell line by the addition of doxycycline. Left, lysates were prepared after 3 days and used for Western analysis with the indicated antibodies. Middle, cells were incubated for an additional 24 hr with DMSO or SGC-CBP30 (2.5 μM) and fixed for cell cycle analysis by flow cytometry. Representative histograms of two biological replicate experiments are shown. Right, Cells were incubated for 6 days in the presence of SGC-CBP30 (2.5 μM). Viable cells were counted by flow cytometry and percent growth was calculated relative to the DMSO-treated condition for induced or uninduced cells. Values represent the mean of n = 3 technical replicates, ± SEM (B) Cells were induced as in (A) and were treated with DMSO or SGC-CBP30 (2.5 μM) for 6 hr. Expression of MYC was measured by qRT-PCR, normalized to GAPDH, and expressed relative to uninduced cells treated with DMSO. Values represent the mean of n = 3 technical replicates, ± SEM. (C) As in (B) except cells were treated for 24 hr and lysed for Western analysis with the indicated antibodies. Values represent the ratio of GAPDH-normalized MYC expression relative to uninduced DMSO-treated cells. (D) MYC expression was induced in the LP1/MYC cell line by the addition of doxycycline. Cells were incubated for an additional 24 hr with DMSO or SGC-CBP30 (2.5 μM) and fixed for cell cycle analysis by flow cytometry. Representative histograms of two independent experiments are shown. (E) RNA sequencing data from Figure 3A is expressed as the mean of the two biological replicates ( ± SEM) normalized to DMSO-treated cells. (F) Model for the suppression of the IRF4/MYC axis by CBP/EP300 and BET bromodomain inhibitors.


