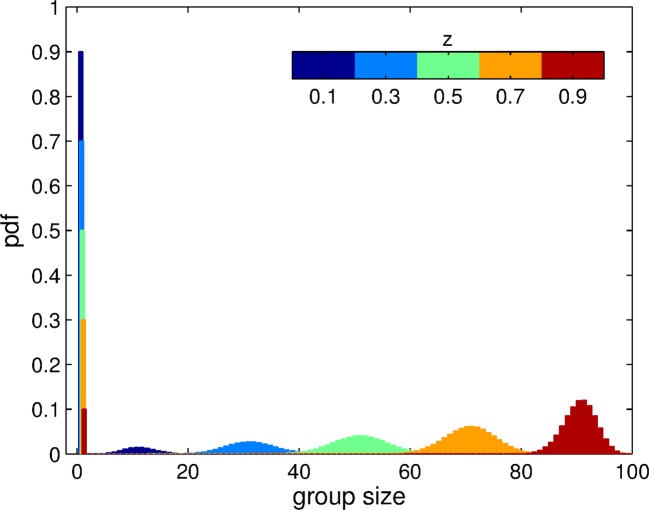
Figure 2. Group size distribution experienced by individuals in a momomorphic population with trait value , for the aggregation process based on adhesion. .
The size of each patch is . The distribution is composed of a fraction of ungrouped individuals () and a binomial distribution of grouped individuals centered on . Here, we display this distribution for 5 distinct values of .

