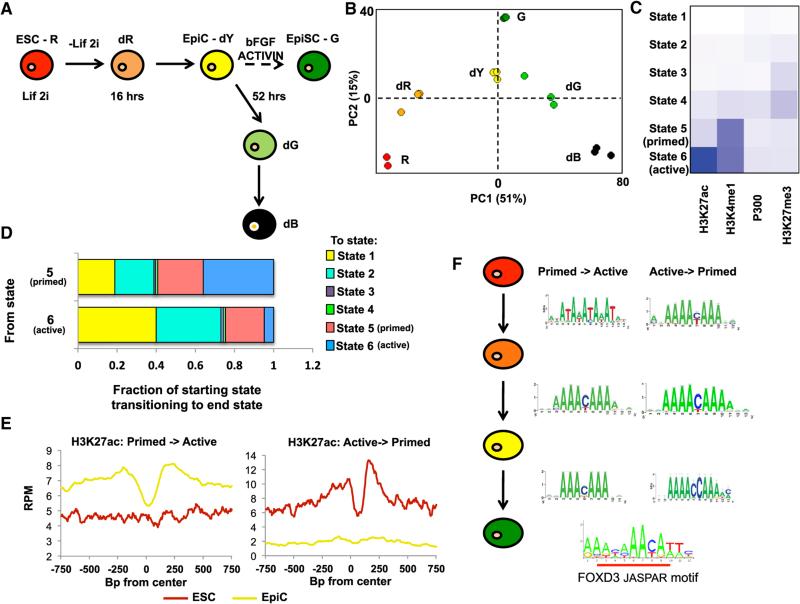
Figure 1. Profiling of Changing Enhancers Identifies FOXD3 as a Key Player during the Transition from the ESC to EpiC State.
(A) Schematic of transitions followed during early differentiation from ESCs (R) to EpiCs (dY). Colors represent expression from miR-290 locus (Red or R, mCherry), miR-302 locus (Green or G, eGFP), both (Yellow or Y), or neither (Black or B). The letter “d” prior to color represents cells undergoing differentiation from ESCs (R) to dR (16 hr off LIF and 2i) to EpiCs (dY) (52 hr off LIF and 2i). Subsequent differentiation yields non-homogenous transition of cells toward dG (green) and dB (black, no reporters), which are FACS sorted for purity. G is a derived self-renewing EpiSC state grown in FGF and Activin. It requires multiple passages in FGF and Activin prior to establishment, represented as a broken line.
(B) Principal component analysis of microarray data of the populations in (D). Array data can be found at GEO: GSE54341 (Parchem et al., 2014).
(C) Heatmap of six states of chromatin determined by ChromHMM using H3K4me1, H3K27ac, H3K27me3, and P300 ChIP-seq data in R, dR, dY, and G cells. States 1–3 represent the majority of the genome and show a general lack of these markers (percentages of genome in states 1 and 2 are shown in pie chart in Figure S4). State 3 shows increased H3K27me3 consistent with heterochromatin. State 4 similarly shows increased H3K27me3, but also detectable levels of H3K4me1. States 5 and 6 show low H3K27me3 and increased H3K4me1. State 5 shows low levels of H3K27ac, while state 6 shows elevated H3K27ac. Intensity of blue indicates average ChIP-seq signal for each modification in each state.
(D) Genome-wide transitions from states 5 and 6 to all states 1–6. x axis shows the two starting states 5 and 6, and the bar graphs represent the distribution of the end states (1–6) for the matching regions following transition between ESC and EpiC.
(E) Metagene analysis of H3K27ac levels centered around enhancers that transition from state 5 (“primed”) to state 6 (“active”) (left), or vice versa (right). Enhancers were defined by the identification of nucleosome-depleted regions in state 6 chromatin as determined by an adapted algorithm (Wamstad et al., 2012) (see Experimental Procedures). Metagene analysis for a 750 bp region surrounding the defined enhancer is shown, with a moving window average of 500 bp windows and 100 bp steps.
(F) RSAT (regulatory sequence analysis tool) was used to identify enriched motifs within nucleosome-depleted regions of identified enhancers that transition between primed and active during ESC to EpiC differentiation (Thomas-Chollier et al., 2011). Shown is the most commonly identified motif found in all transitions between poised and active enhancers, which significantly overlaps with the JASPAR motif for FOXD3 (overlap underlined in red). Significance and enrichment of overlap with FOXD3 and other uncovered TF binding are shown in Table S2.

