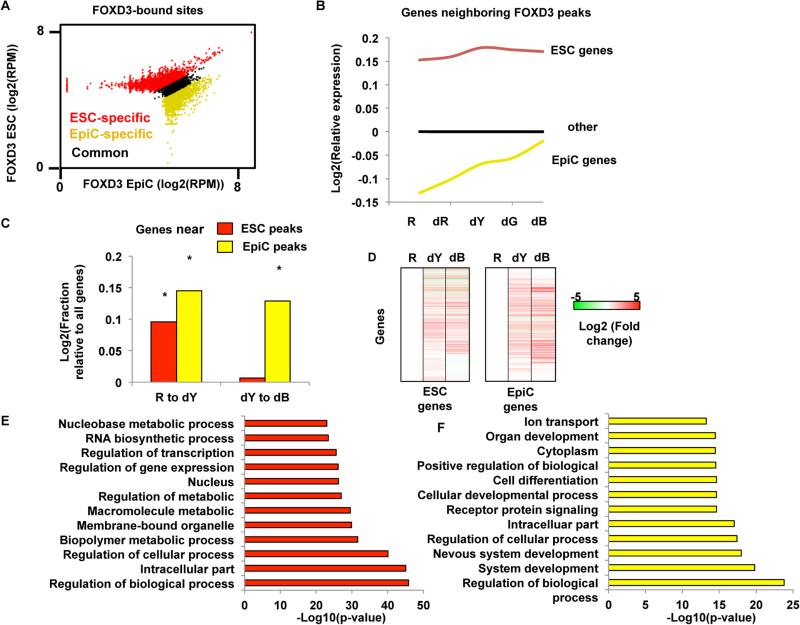
Figure 2. FOXD3 Is Mobilized during the Transition from the ESC to EpiC State, and Its Departure Is Associated with Increased Gene Expression.
(A) Scatterplot of reads per million (RPM) at the union of all peaks identified by MACS (Zhang et al., 2008) in both ESCs and EpiCs. Peaks were re-characterized as ESC-specific (red), EpiC-specific (yellow), and common peaks (black) based on their distance from the x = y diagonal (threshold set at ± 0.1) to obtain high-confidence specific peaks (q < 0.01). ESC only peaks = 5,350. EpiC only peaks = 6,737. Common peaks = 1,650. Samples were prepared in triplicate.
(B) mRNA expression (from Illumina microarray data) for genes closest to FOXD3 peaks in ESC (red line) and EpiC (yellow line), as well as all other genes on the array (blue line). Microarray experiments were performed in R (ESC), dR, dY (EpiC), dG, and dB cells. dG and dB (differentiated Black) represent further sequential differentiation following EpiCs during continued culture in the absence of LIF and 2i. For this experiment, all populations were collected by FACS. Data shown are all relative to all genes in the ESC state.
(C) Fraction of genes with increased expression from ESCs (R) to EpiCs (dY), as well as from EpiCs (dY) to dG, for genes near FOXD3 peaks compared with all other genes. Genes associated with ESC FOXD3 peaks increase with transition to EpiC but then level off. In contrast, genes associated with EpiC FOXD3 peaks continue to go up after EpiC. Asterisk (*) denotes Z scores > 2, p < 0.05 relative to genes without FOXD3 peaks.
(D) Heatmap showing hierarchical clustering (single linkage) of all genes shown in (F) and (G) for the transition from ESC (R) to EpiC (dY) to dB. Data are shown as a log2 transformed fold change relative to ESCs.
(E) Top 12 GO terms identified by gene ontology analysis using DAVID for genes near FOXD3 peaks in ESCs.
(F) Same as in (D) for genes near FOXD3 peaks in EpiCs.

