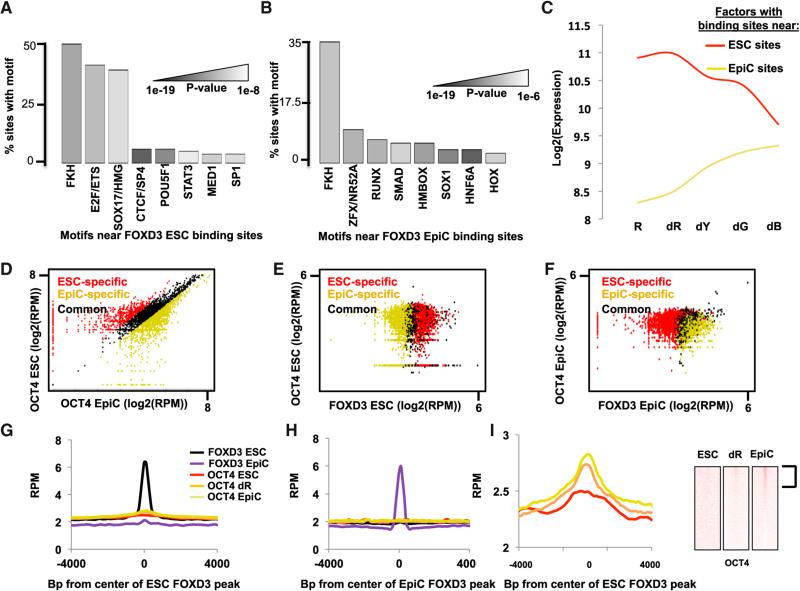
Figure 3. FOXD3 Precedes Binding of Other TFs, Such as OCT4, at Enhancers.
(A) Motifs enriched within a 200 bp window surrounding FOXD3 peaks in ESCs cells, shown as a percentage of peaks containing the motif. Shades of gray represent p values as shown (full data in Table S2).
(B) Same as (A) but for FOXD3 peaks in EpiCs (full data in Table S2).
(C) Average expression of TFs whose motifs were found to be neighboring FOXD3 in either ESCs or EpiCs. For motifs with multiple potential binding TFs, an average of all family members was used. The red line is for TFs to motifs associated with FOXD3 sites in ESCs and the yellow line is for TFs to motifs associated with Foxd3 sites in EpiCs.
(D) Scatterplot of RPM in ESCs versus EpiCs at all OCT4 peaks. ESC-specific OCT4 peaks are in red, EpiC-specific peaks are in yellow, and common peaks are in black. Similar to FOXD3, OCT4 shows very distinct binding sites in ESCs and EpiCs, even though sites are distinct from FOXD3. Peaks were identified similarly to FOXD3 peaks in Figure 3A.
(E) Scatterplots of RPM for peaks of OCT4 (y axis) versus RPM for peaks of FOXD3 (x axis) in ESCs. ESC-specific FOXD3 peaks are in red, EpiC-specific peaks are in yellow, and common peaks are in black.
(F) Same as (E), but in EpiCs.
(G) Metagene analysis summarizing OCT4 and FOXD3 binding for regions surrounding FOXD3 peaks in ESCs. Shown are the data for ESCs in a 4,000 bp region surrounding the FOXD3 peaks using a moving window average of 500 bp at 100 bp steps.
(H) Same as (G), but in EpiCs.
(I) Magnification of OCT4 binding data shown in (G) along with heatmap showing binding of OCT4 in dR and EpiCs, at sites bound by FOXD3 in ESCs.

