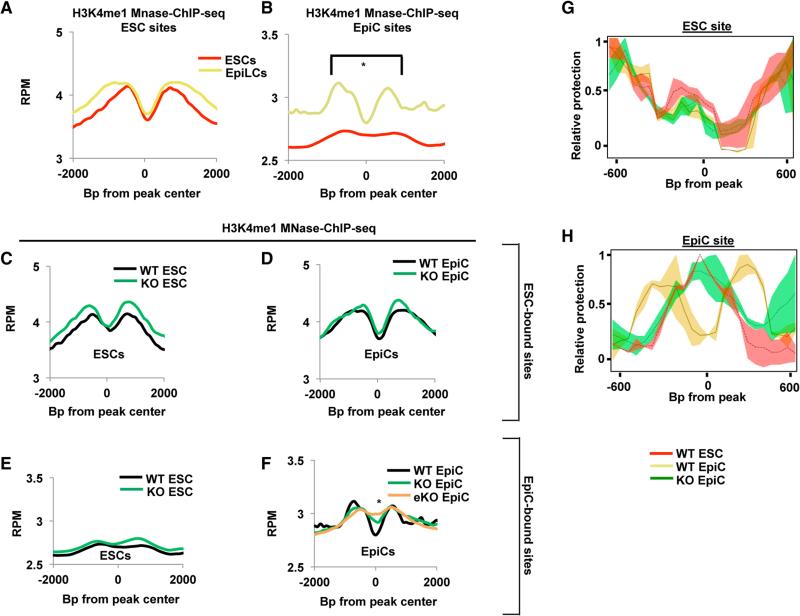
Figure 4. FOXD3 Binds Nucleosome Occupied Sites and Establishes Primed Enhancers.
(A) Metagene analysis of H3K4me1 MNase-ChIP-seq data for ESCs (red line) and EpiCs (yellow line) in a 4,000 bp window surrounding FOXD3-bound sites in ESCs.
(B) Same as (A) but for EpiC-bound sites. Asterisk (*) denotes paired Student's t test, p < 0.05.
(C) Metagene analysis of H3K4me1 MNase-ChIP-seq data from WT and Foxd3 KO ESCs using a 4,000 bp window surrounding FOXD3-bound sites in ESCs. Data are shown for WT (black line) and Foxd3 KO (green line) cells.
(D) Same as (C) but in EpiCs. In addition, data are shown for KO of Foxd3 16 hr prior to differentiation (orange line; KO-l stands for KO long).
(E) Metagene analysis of H3K4me1 MNase-ChIP-seq data from WT and Foxd3 KO ESCs using a 4,000 bp window surrounding FOXD3-bound sites in EpiCs. Data are shown for WT (black line) and Foxd3 KO (green line) cells.
(F) Same as (E) but in EpiCs. In addition, data are shown for KO of Foxd3 16 hr prior to differentiation (orange line; eKO stands for early KO).
(G) MNase tiling qPCR at an ESC enhancer (see Supplemental Experimental Procedures for primers) in WT ESCs, WT EpiCs, and early Foxd3 KO EpiCs. The graph represents an average of n = 2–3 experiments for each primer pair. Unpaired Student's t tests were conducted for WT and Foxd3 KO EpiCs, and the heatmap for the p values for this test is shown below the graph. ANOVA for a three-way comparison of WT ESCs, WT EpiCs, and Foxd3 KO EpiCs was also performed (p = 0.97964, not shown on graph).
(H) Same as (F) but for an EpiC enhancer, with t test p values shown as a heatmap. ANOVA p = 1.111e–07, not shown on graph.

