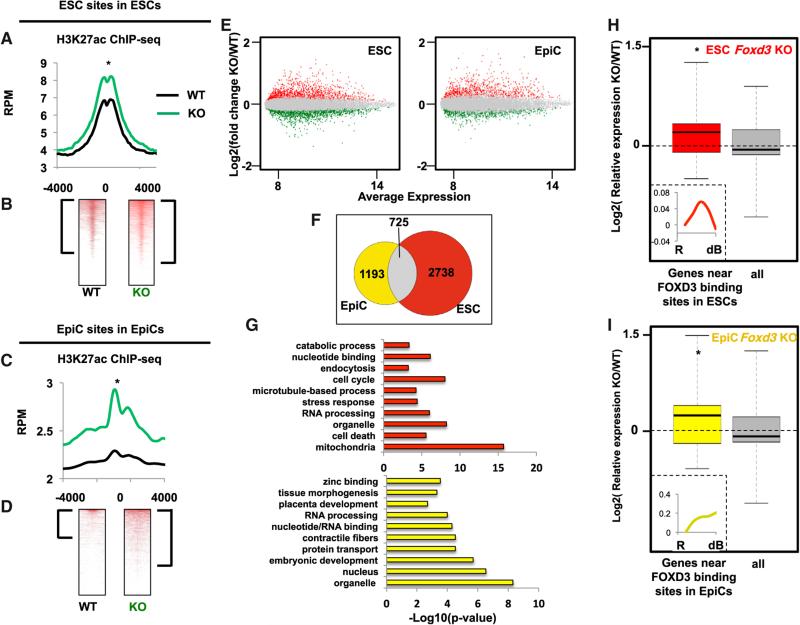
Figure 5. FOXD3 Maintains Lower Levels of Histone Acetylation at Enhancers.
(A) Metagene analysis of H3K27ac ChIP-seq data from WT and Foxd3 KO ESCs using a 4,000 bp window surrounding FOXD3-bound sites in EpiCs. Data are shown for WT (black line) and Foxd3 KO (green line) cells. Asterisk (*) denotes paired Student's t test, p < 0.05.
(B) Data in (A) shown as heatmaps. Brackets represent genes with significant peaks of H3K27ac (signed-rank test, p < 0.05).
(C) Same as (A) but for H3K27ac ChIP-seq at EpiC sites. Asterisk (*) denotes paired Student's t test, p < 0.05.
(D) Data in (C) shown as heatmaps. Brackets represent genes with significant peaks of H3K27ac (signed-rank test, p < 0.05).
(E) Scatterplot showing average gene expression on the x axis and fold change between WT and Foxd3 KO cells on the y axis. Data are shown on the left for ESCs and the right for EpiCs. Points in red are significantly upregulated (adj. p < 0.05) and points in green are significantly downregulated (adj. p < 0.05).
(F) Venn diagram showing overlap of upregulated and downregulated genes upon Foxd3 KO in ESCs and EpiCs (adj. p < 0.05).
(G) Top ten GO terms identified by gene ontology analysis using DAVID for genes affected by Foxd3 KO in ESCs (top) and EpiCs (bottom).
(H) Microarray expression data for WT and Foxd3 KO ESCs. Plotted are all genes that are significantly changed upon Foxd3 KO (“all”) versus genes near FOXD3 binding sites. (Asterisk denotes p < 0.05 and Z > 2 in comparison between two populations). All n = 2142 and FOXD3 n = 511. Inset: expression of FOXD3-bound and Foxd3 KO-affected genes (n = 511) during differentiation.
(I) Same as (G), but for EpiCs. All n = 1,800 and FOXD3 n = 412. Inset: expression of FOXD3-bound and Foxd3 KO-affected genes (n = 412) during differentiation. ChIP-seq samples were performed in duplicate.

