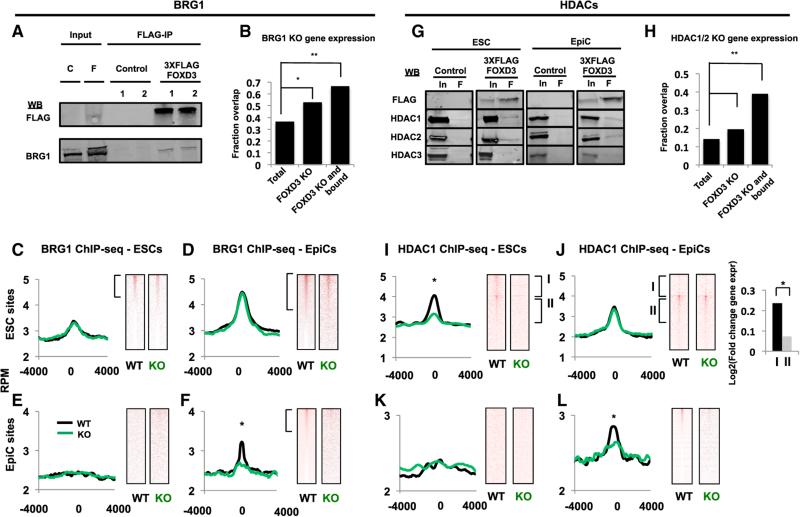
Figure 6. FOXD3 Recruits the Chromatin Remodeling Swi/Snf Complex and the Histone Deacetylases HDAC1/2 to Target Enhancers.
(A) Immunoprecipitation using M2 anti-FLAG resin (FLAG-IP) on extract from WT (C, Control) and FOXD3-3X-FLAG targeted (F, 3XFLAG FOXD3) cell lines (1, 2). Western blots for FLAG and BRG1 are shown. Inset: 10% of input. Representative blot for n = 3 is shown.
(B) Overlap of mRNA expression changes in Brg1 KO and Foxd3 KO relative to WT mouse ESCs. The proportion of genes affected by Brg1 KO is shown as a total of all genes, genes altered by Foxd3 loss, and genes both bound by FOXD3 and altered by Foxd3 loss. The latter two categories are significantly enriched for genes whose expression is changed by Brg1 deletion. Results of a Chi-square test are shown. *χ2 = 125, p < 2.2e–16. **χ2 = 346, p < 2.2e–16.
(C) Metagene analysis (left) of BRG1 ChIP-seq data from WT and Foxd3 KO ESCs using a 4,000 bp window surrounding FOXD3-bound sites in ESCs. WT (black line) and Foxd3 KO (green line) cells are shown. Data are visualized in heatmaps on the right.
(D) Same as (C), but in EpiCs.
(E) Same as (C), but for FOXD3 EpiC bound sites.
(F) Same as (D), but for FOXD3 EpiC bound sites. Asterisk (*) denotes paired Student's t test, p < 0.05.
(G) Immunoprecipitation using M2 anti-FLAG resin (F) on extracts from WT (Control) and FOXD3-3X-FLAG targeted (3XFLAG FOXD3) cell lines. Western blots for FLAG, HDAC1, HDAC2, and HDAC3 are shown. Inset: 10% input. Representative blots for n = 3 are shown.
(H) Overlap of mRNA expression changes in HDAC1/2 and Foxd3 KO relative to WT mouse ESCs. The proportion of genes affected by HDAC1/2 KO is shown as a total of all genes, genes altered by Foxd3 loss, and genes both bound by FOXD3 and altered by Foxd3 loss. The latter two categories are significantly enriched for genes changed by HDAC1/2 deletion. Results of a Chi-square test are shown. *χ2 = 49, p = 2.5e–12. **χ2 = 127, p < 2.2e–16.
(I) Metagene analysis (left) of HDAC1 ChIP-seq data from WT and Foxd3 KO ESCs using a 4,000 bp window surrounding FOXD3-bound sites in ESCs. Data are shown for WT (black line) and Foxd3 KO (green line) cells. Asterisk (*) denotes paired Student's t test, p < 0.05. Data are visualized in heatmaps on the right. Top bracket represents genes that have significant peaks of HDAC1 in ESCs that are lost in EpiCs (signed-rank test, p < 0.05), and bottom bracket represents genes that have significant peaks of HDAC1 in ESCs that are maintained in EpiCs (signed-rank test, p < 0.05).
(J) Same as (I) but in EpiCs (same brackets on heatmaps as C). Expr, log2 fold change in expression of associated genes from ESC to EpiC, showing a greater fold increase in expression of genes that lose HDAC1. The groups are significantly different, as per an unpaired Student's t test (p < 0.05).
(K) Same as (I) but for FOXD3 EpiC bound sites.
(L) Same as (I) but for FOXD3 EpiC bound sites. Asterisk (*) denotes paired Student's t test, p < 0.05. ChIP-seq samples were performed in duplicate.

