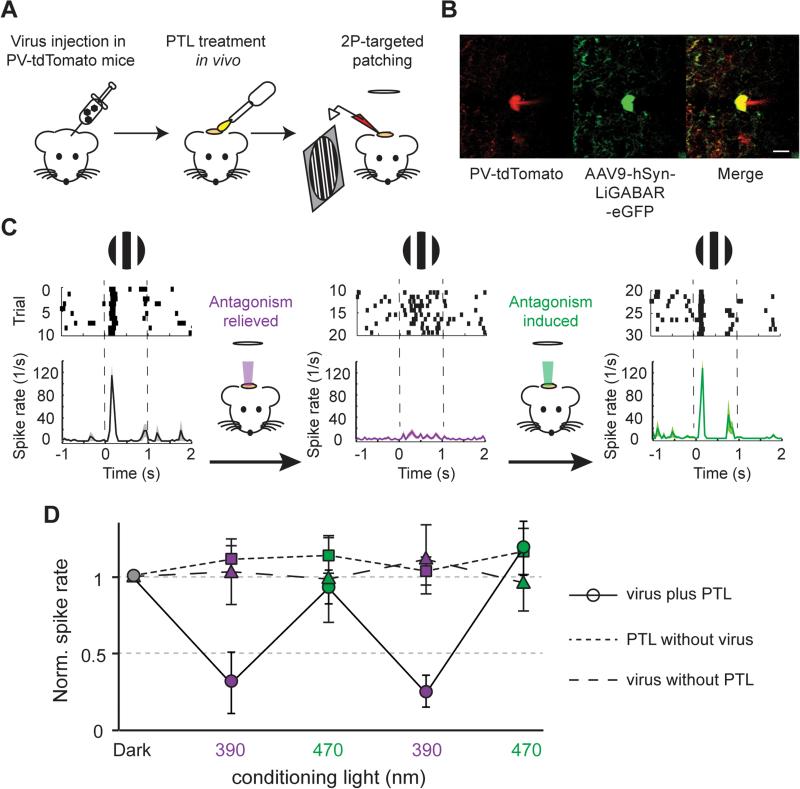
Figure 6. In vivo Photo-control of Visual Responses in the Mouse Cortex.
(A) Schematic illustration of the experimental procedures.
(B) Two-photon image of a recorded PV+ neuron. The cell was identified by the co-expression of tdTomato (red, marker of PV+ cell) and eGFP (green, marker of LiGABAR expression).
(C) Experimental sequence. The raster plots and peristimulus time histograms show the spike activity of a PV+ neuron before any conditioning illumination (black), and after a 10-sec exposure to either 390 nm (violet) or 470 nm (green) light.
(D) Summary of visually evoked spike activities in PV+ neurons (circles), showing higher firing rates when LiGABAR was antagonized (dark and 470 nm) than when it was relieved from antagonism (390 nm). n = 7 cells from 4 mice. Control experiments with PTL treatment alone (squares; n = 6 cells from 2 mice) or viral injection alone (triangles; n = 9 cells from 2 mice) show no significant difference in spike activities after exposure to 390 nm vs. to 470 nm light. Data are plotted as mean ± SEM.

