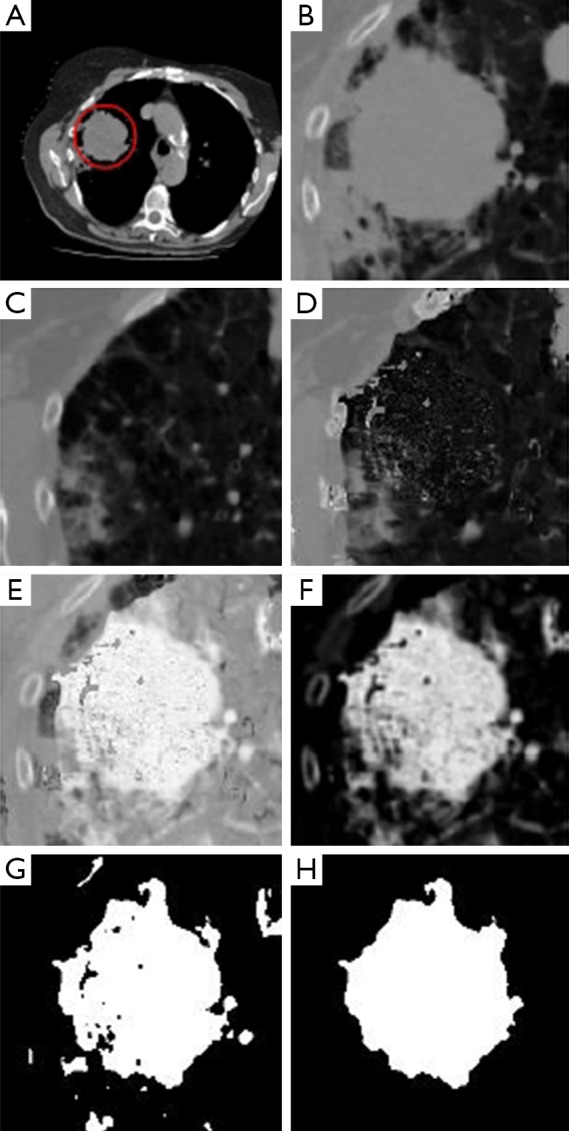
Figure 3.

An example illustrating all the steps of the proposed approach: (A) Input image and ROI defined in red by an expert; (B) ROI extracted from the input image; (C) ROI extracted from the reference image; (D) background estimation result; (E) result of background subtraction; (F) result after refinement of image; (G) result of applying Otsu’s threshold; (H) final segmentation result after morphological operations. ROI, region of interest.
