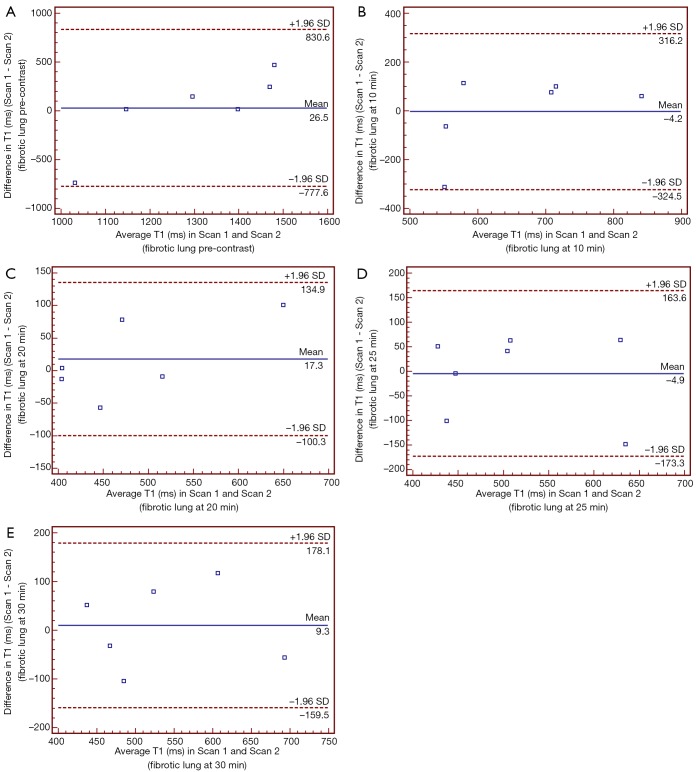
Figure 5.
Analysis of agreement between pre- and post-contrast T1 values of fibrotic lungs in the repeated scans. The solid line shows the mean difference and the dotted lines show the two SD limits of agreement. T1 values in all cases remains within the limits of agreement. The mean difference (bias) between T1 levels is relatively small. (A) pre-contrast; (B–E) 10, 20, 25, and 30 min post-contrast. SD, standard deviation.

