
Figure 1. Somatic alterations in papillary renal cell carcinoma underlie molecular differences between Type 1 and Type 2 cancers.
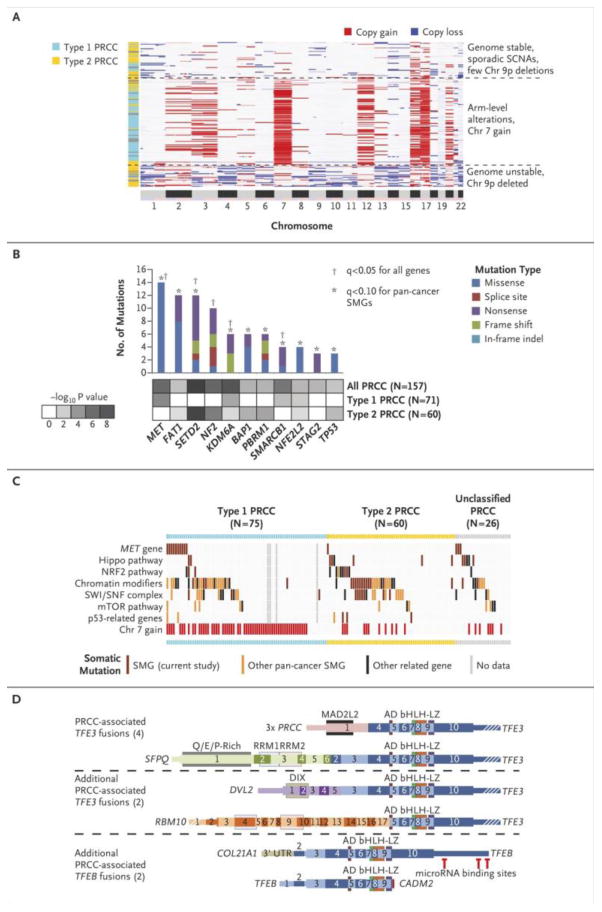
(a) Unsupervised clustering of DNA copy profiles of papillary renal cell carcinoma, revealing three molecular subtypes, one of which is highly enriched for Type 1 tumors (light blue) and the other two, for Type 2 tumors (yellow). (b) Significantly mutated genes (SMGs) in papillary renal cell carcinoma, determined by considering all genes (q<0.1, range 0.0-1.0) or focusing on the set of 260 genes previously implicated in cancer by large-scale, pan-cancer exome analyses26 (q<0.1). p-values by MutSig 2CV algorithm. (c) Pathway-centric view of gene mutations in papillary renal cell carcinoma, involving key pathways and genes implicated in cancer, either in this present study or elsewhere as indicated.26 The tumors were classified by histological type from left to right: Type 1 (light blue), Type 2 (yellow) or unclassified papillary renal cell carcinoma (gray), and from top to bottom by gene or pathway altered. Pathways and genes represented include: MET, HIPPO pathway (NF2, SAV1, WWC1), NRF2 pathway (NFE2L2, KEAP1, CUL3, SIRT1, FH), chromatin modification (CREBBP, DOTL1, EHMT1/2, EP300, EZH1/2, KAT2A/B, KDM1A/B, KDM4A/B, KDM5A/B/C, KDM6A/B, MLL1/2/3/4/5, NSD1, SETD2, SMYD4, SRCAP), SWI/SNF complex (ACTB, ACTL6A/B, ARID1A/B, ARID2, BCL6A/B/C, BCL11A/B, BRD7/9, DPF1/2/3, PHF10, PBRM1, SMARCA2/4, SMARCB1, SMARCC1/2, SMARCD1/2/3, SMARCE1), mTOR pathway (MTOR, PIK3CA, PTEN, STK11, TSC1, TSC2), and p53 pathway (ATM, CDKN1A, CDKN2A, FBXW7, RB1, TP53). (d) Fusion gene analysis identified TFE3 or TFEB fusions in 8 PRCC tumors, including two novel gene fusion partners for TFE3, DVL2 and RBM10, and two novel gene fusion partners for TFEB, COL21A1 and CADM2. Schematic versions of these fusions demonstrate the exons and functional domains that are present within the different gene fusions and the position of potential miR binding sites in TFEB. The retained exons of TFE3 or TFEB are colored in shades of blue. Thin regions represent non-coding sequence, while thick regions represent the translated reading frame and white strips indicate the region is no longer to scale. AD = Strong Transcription Activation Domain, bHLH = Basic Helix-Loop-Helix Domain, LZ = Leucine Zipper Domain, MAD2L2 = Mitotic Arrest Deficient-Like 2 Interaction Domain, DIX = Dishevelled and Axin Domain, RMM = RNA-Recognition Motif.